SpyOver Guide
Our first step is to search. You can search ads by: keywords (ad text), by branding, by redirects, by publisher, by landing page text, by outgoing, by offers.
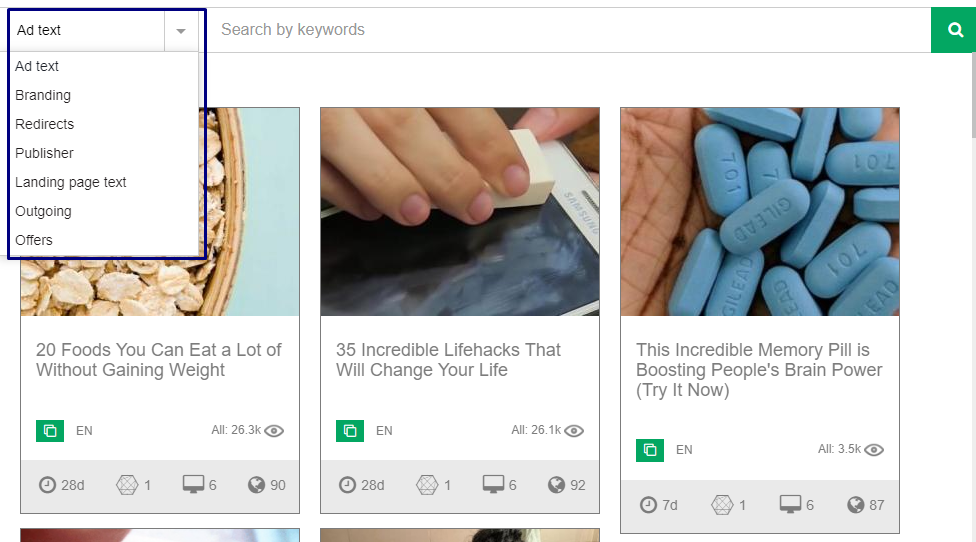
Let’s learn every search option.
- Search by ad text: it’s a search by keywords. What is the best way to search creatives with this option? It depends on your interested vertical. For example, if your vertical nutra - you can enter “Burn Fat”
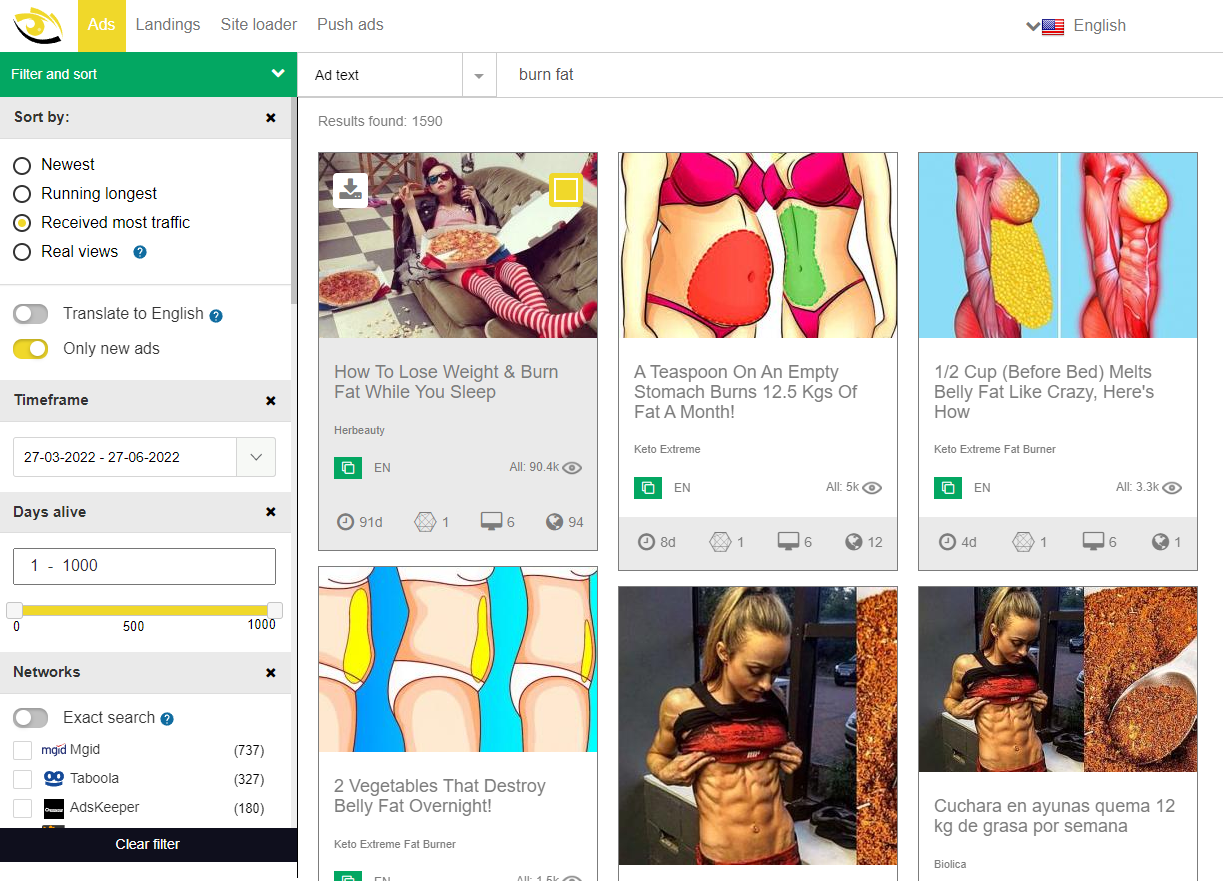
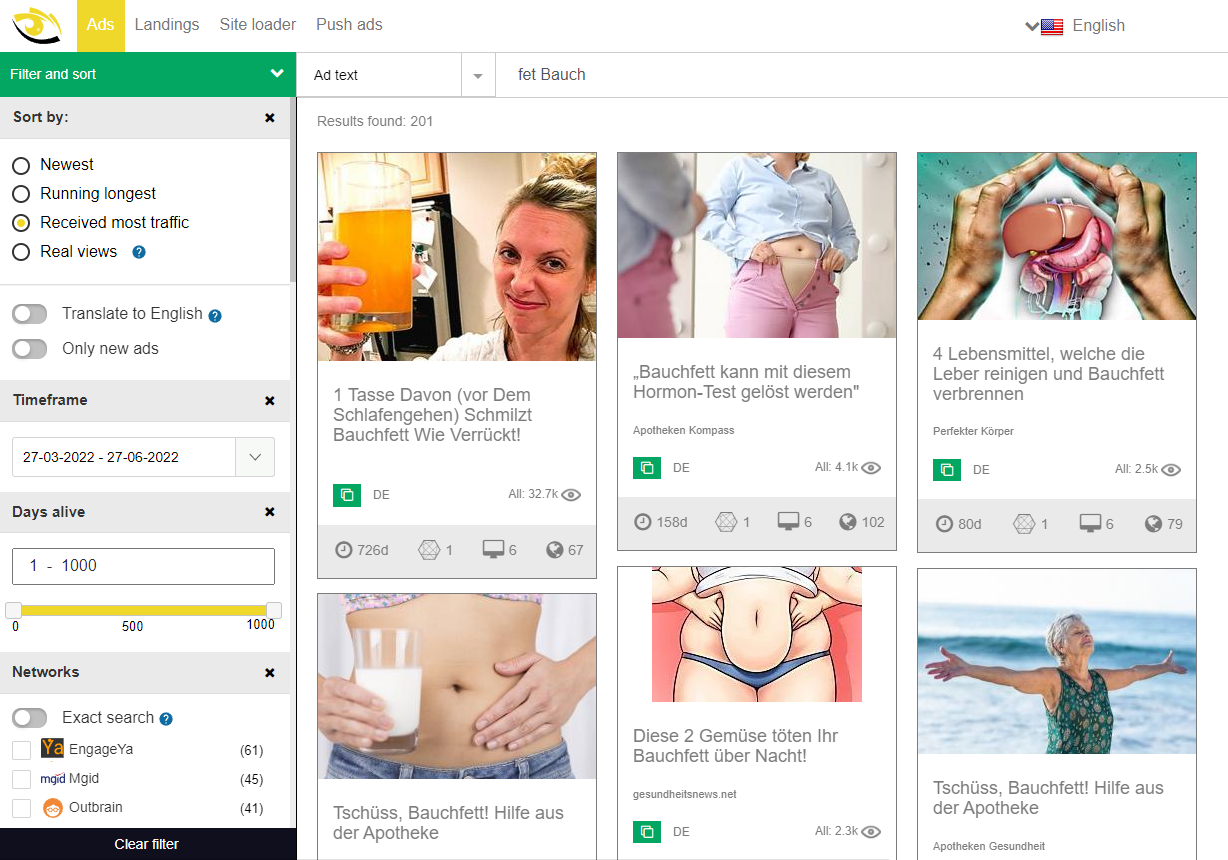
If you are interested in creatives of some specific geos, you should enter keywords in this geos language. That’s way you will get more relevant results.
Let’s look at the second example (nutra vertical too): “fet Bauch” for geo Germany. And analysis results. You can apply filters by geos, ad language, timeframe, but about that we will tell you a little bit later.
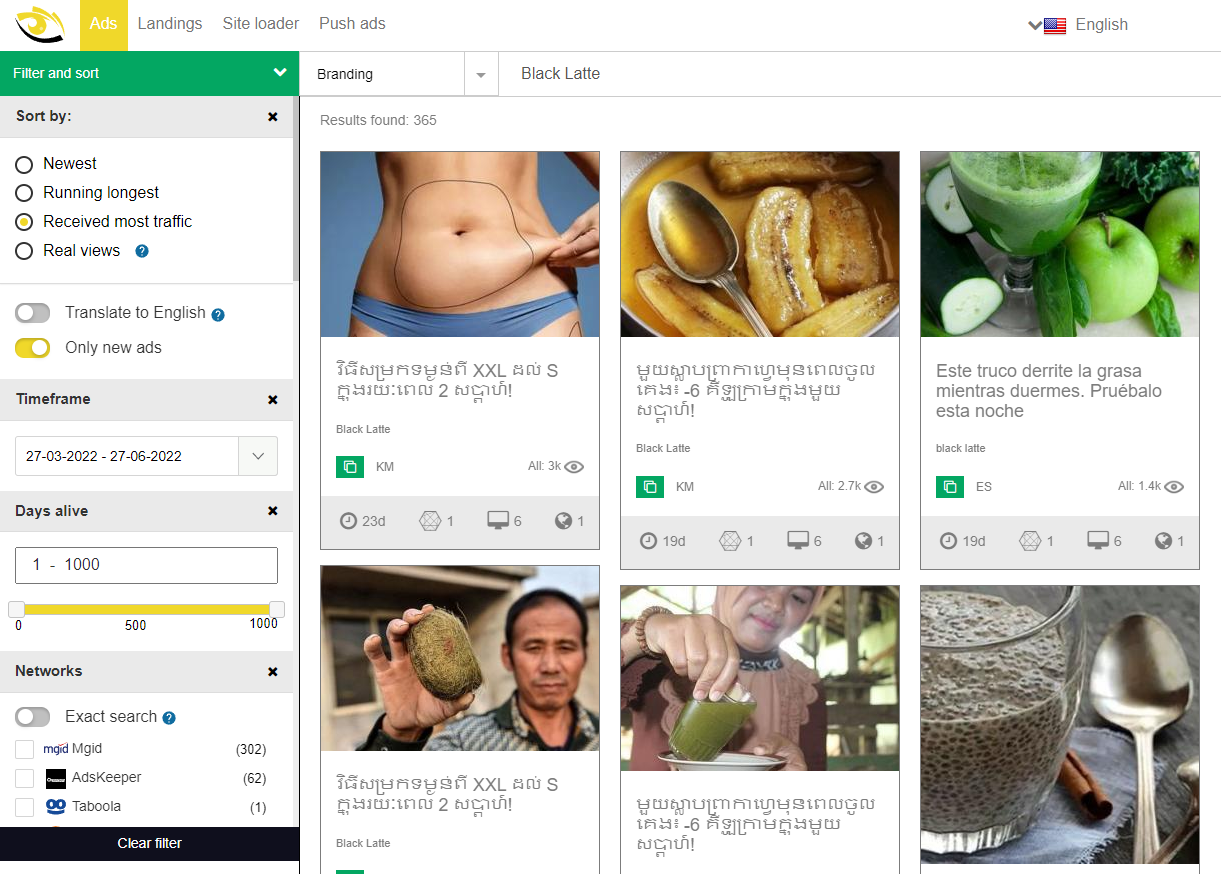
- Search by branding text: choose Branding from the dropdown list, then apply some branding text and get a result with such branding text. Here is an example with Branding text Black Latte.
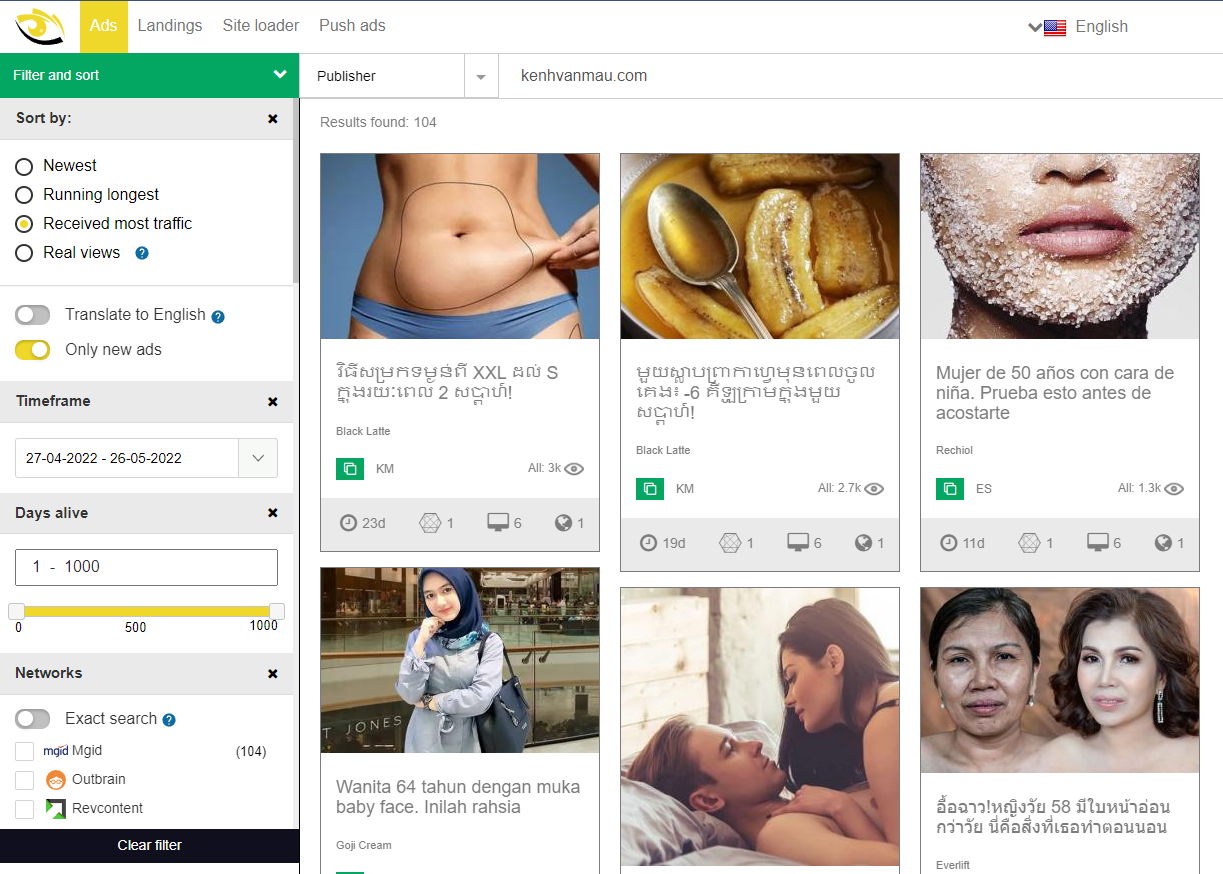
- Are you interested in analyzing all ads that launched in some specific publisher placements? Enter address of publisher placements (previously removing the get parameters from the link) enter in the search field and choose “Publisher”. For example, kenhvanmau.com
Address of publisher placements you can find in the ad card.
This search method you can use for searching and analyzing creatives for specific publisher placements, landings and sites.
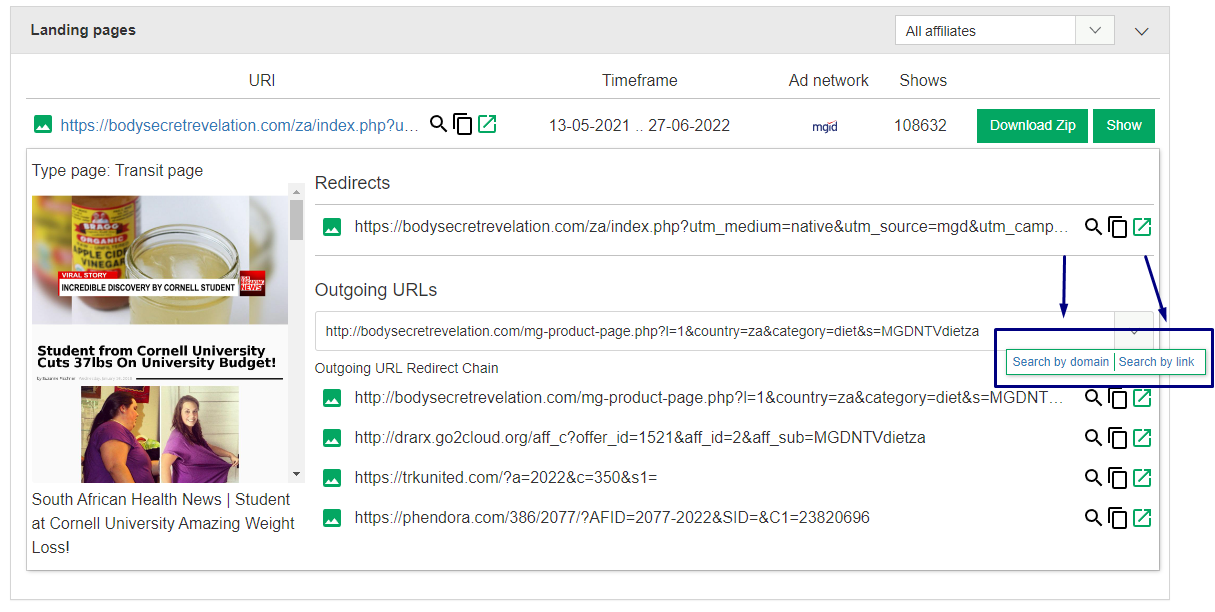
- Search by redirects: in every ad card you can find all redirect links.
You can copy a link in the ad card and paste it in the search field. Or you can open search by domain or search by links from ad card. Easily and simply by clicking on the button as shown in the screenshot below.
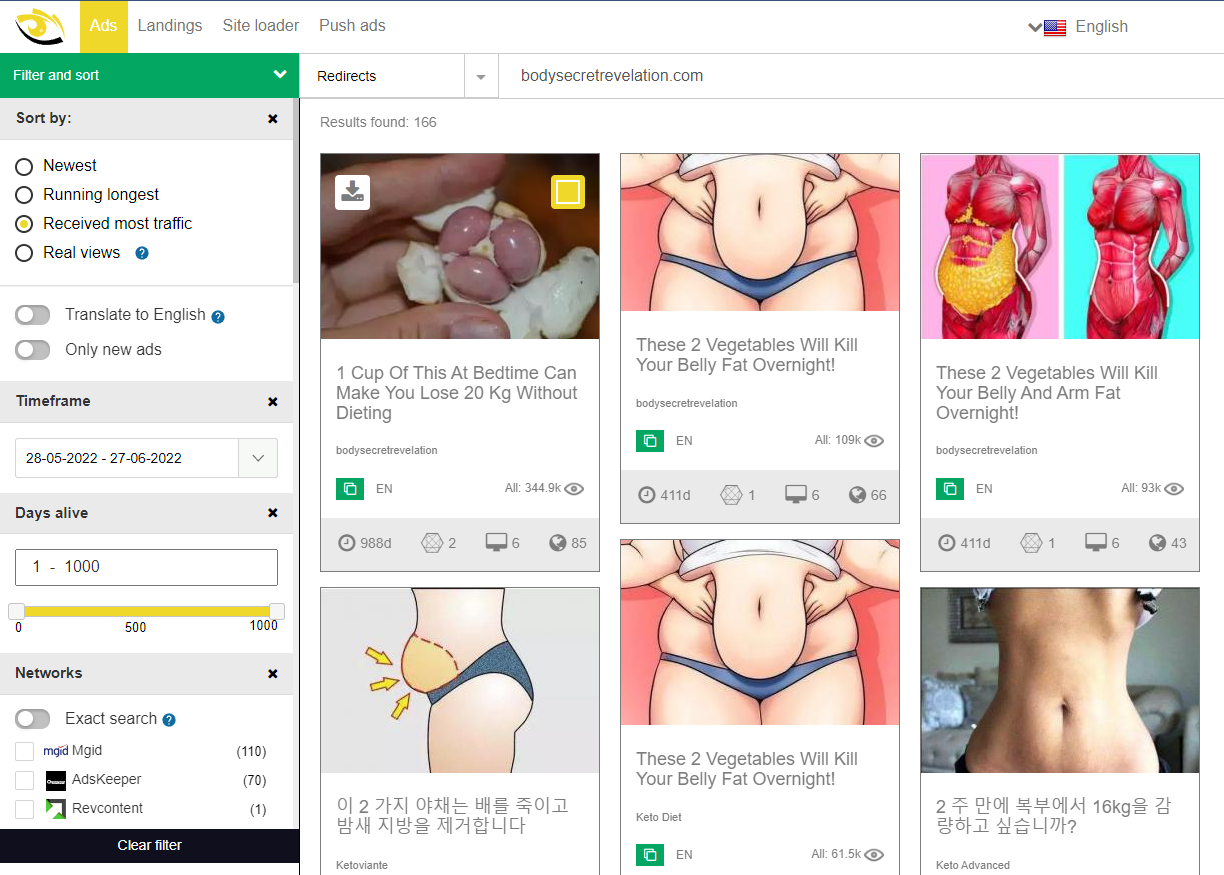
Example search by redirects:
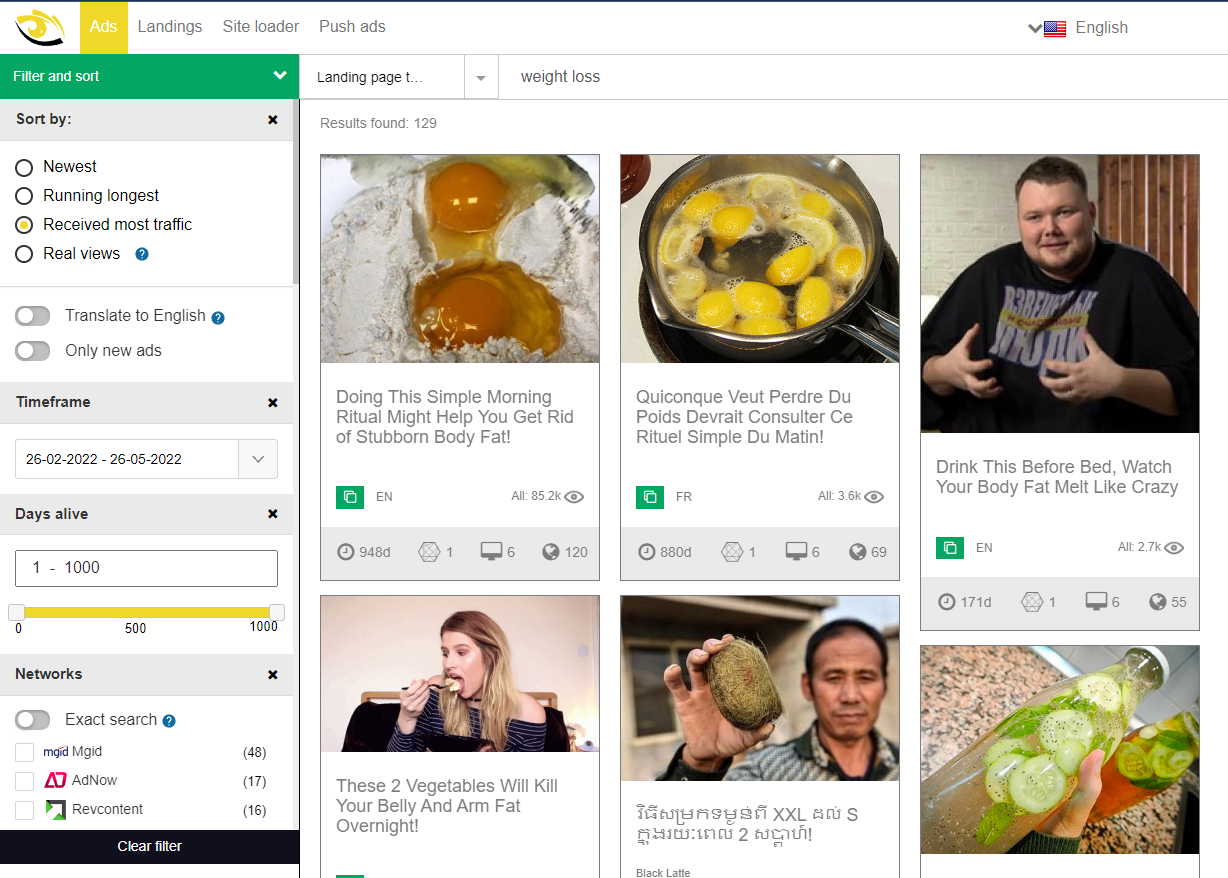
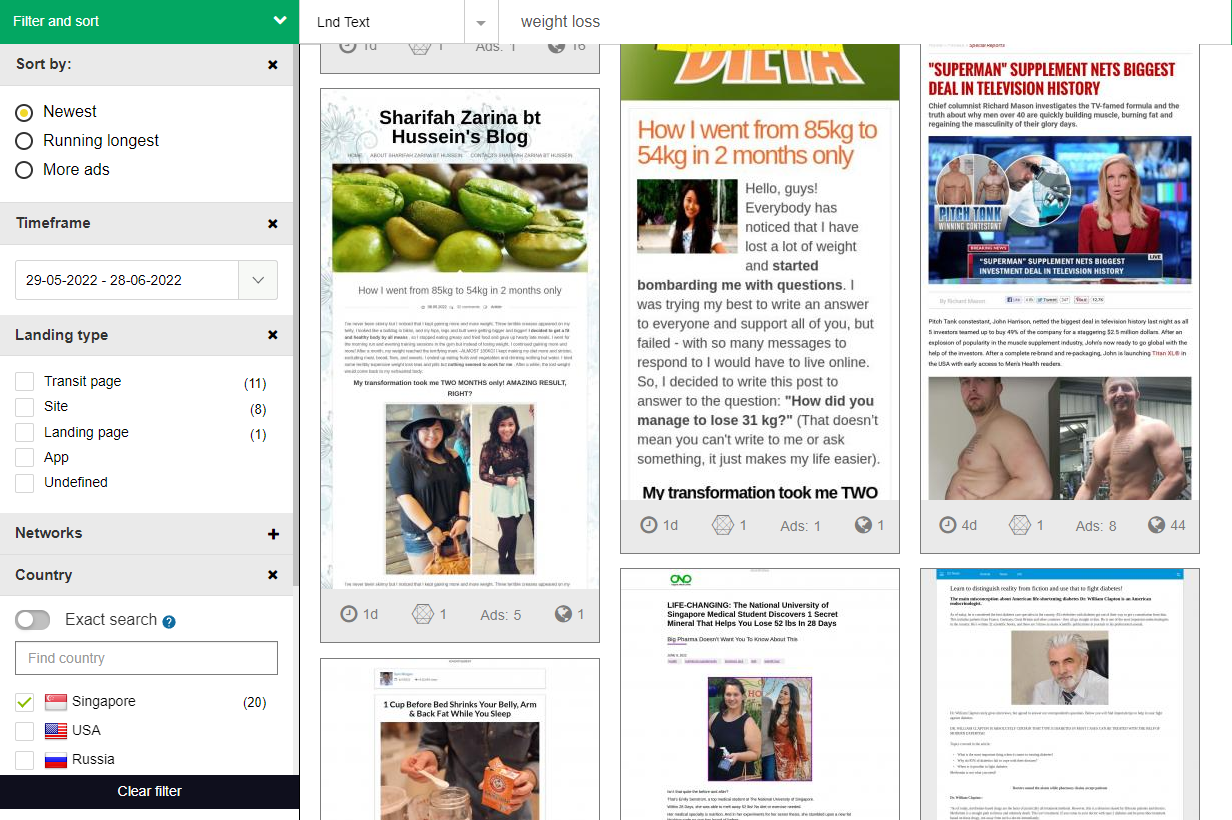
- Search by landing page text: it’s search by keywords which contains in the landing page. For example, you are interested in creatives for weight loss offers, enter keywords “weight loss”. Besides creatives for this vertical we will get landing pages (which you can find in ad cards).
- Search by outgoings: this search option helps to find ads by specific outgoings. You can copy the domain from redirects in the ad card or you can search by outgoings with the link that you have.
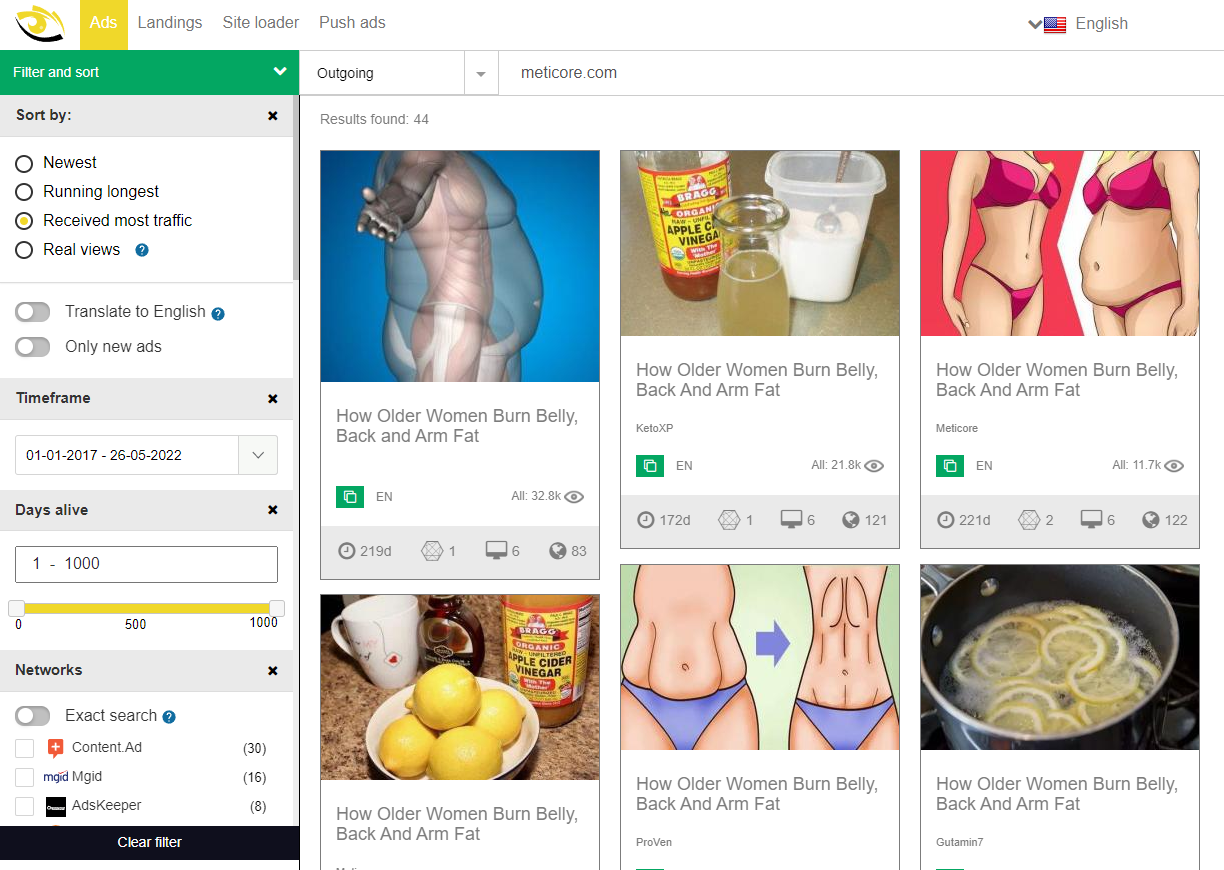
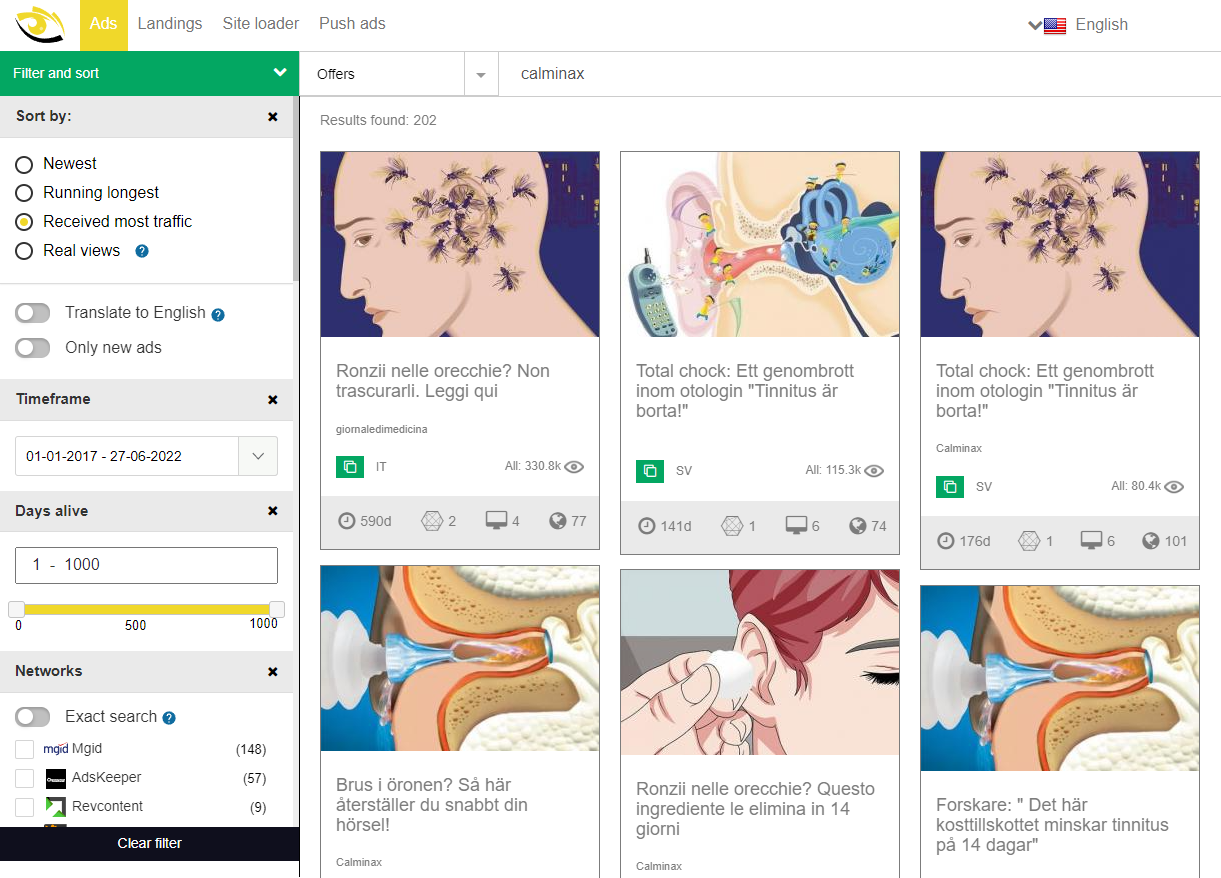
- Search by offers: helps to find all variants of ads by offer title. For example we enter offer title Calminax, previously chosen search by offers and as a result we get a lot of creatives that promote this offer.
GUIDE ABOUT FILTERS AND SORTING
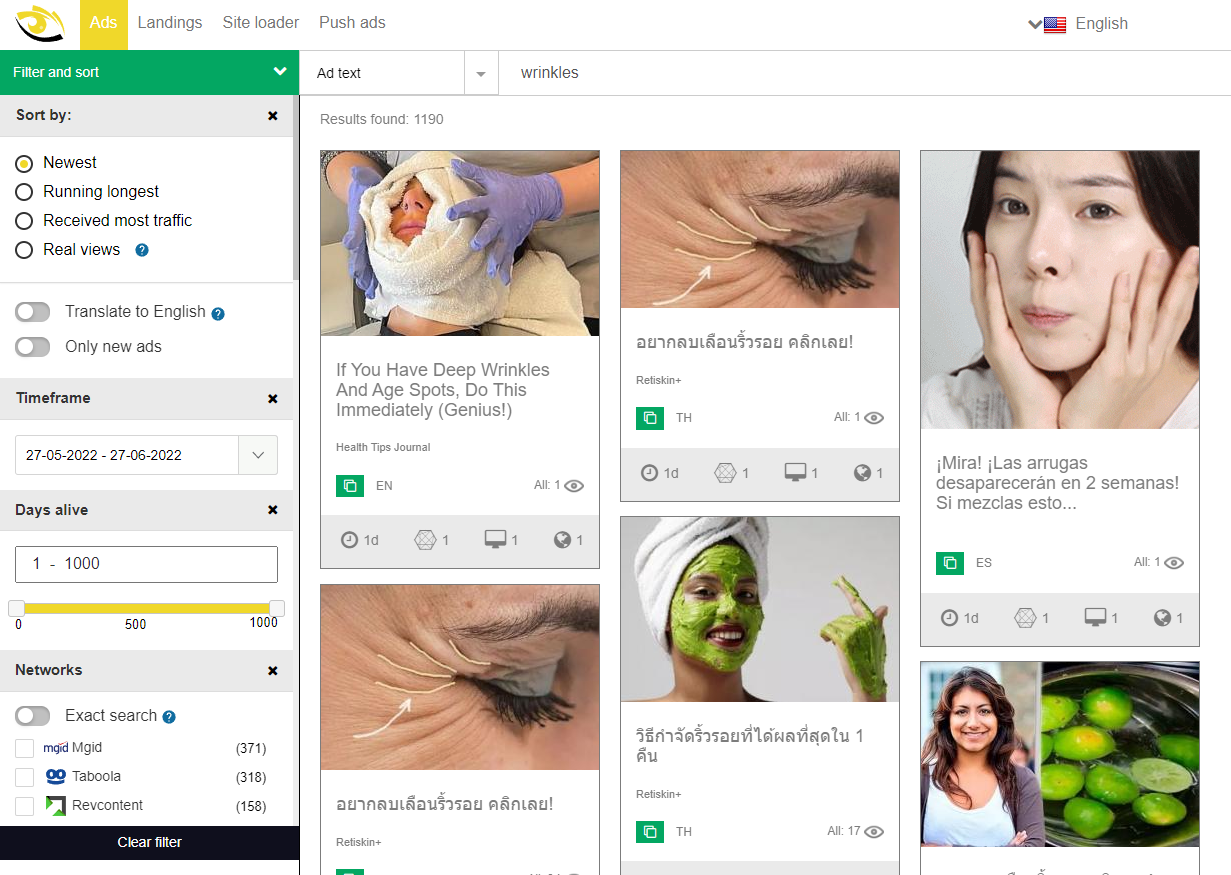
Let’s look at the left menu.
As example we choose keyword “winkles”
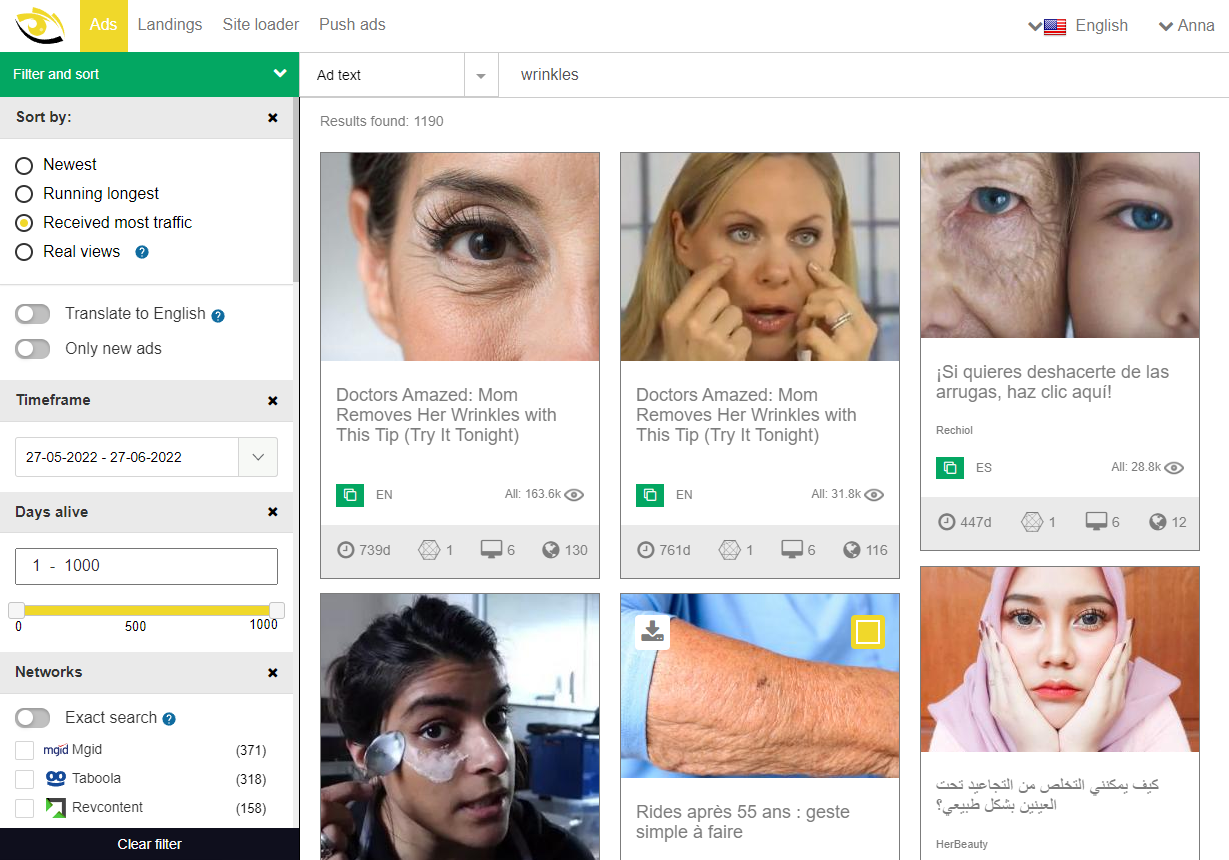
Ads are displayed for the last 30 days by default. If you need more results, choose a longer period (last quarter, all time).
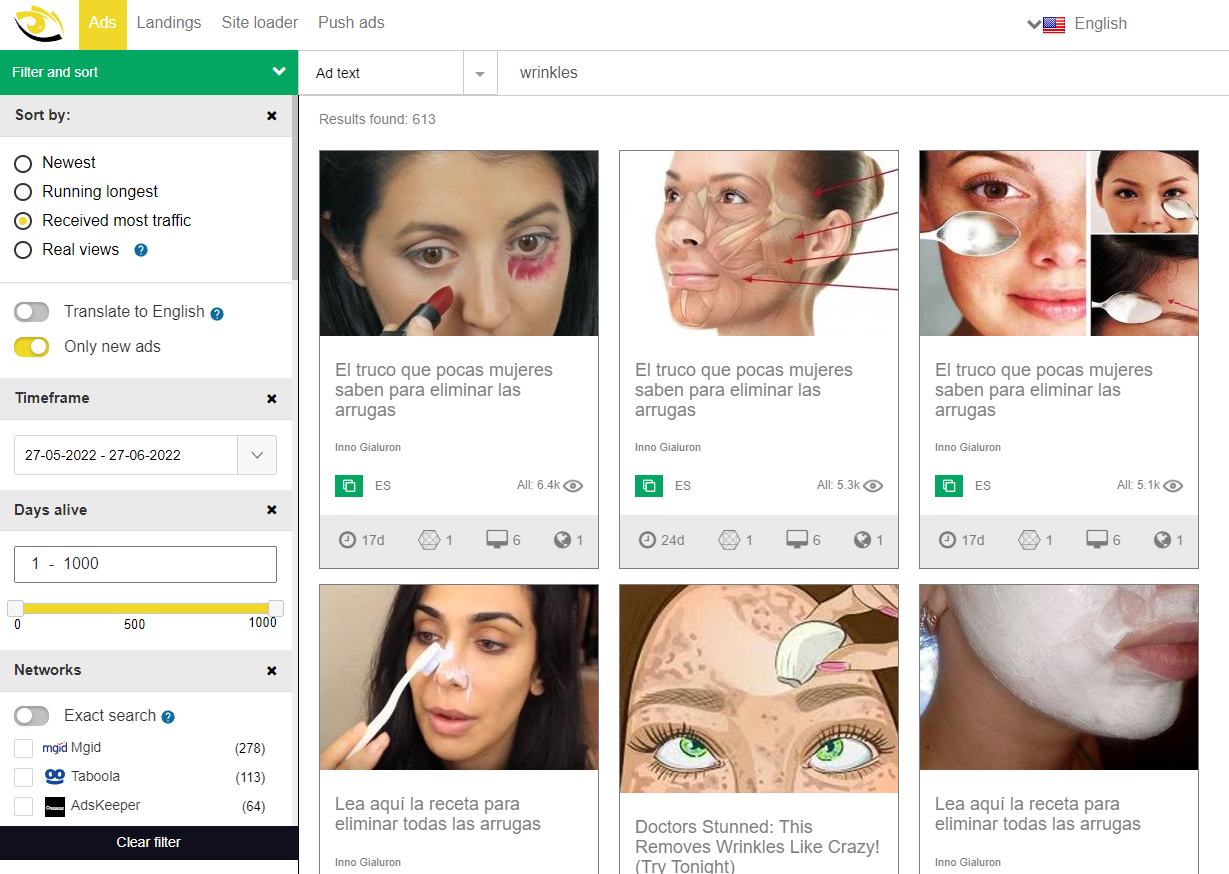
If you want to analyze only new ads you should turn on option Only new ads in the left menu. What happens after the click? You will get only new ads, that were launched in selected period. If Only new ads is turn off - we will get ads that was launched for example 2 month ago and are still promoted now.
Example with turn on “Only new ads”:
We learned how works time frame in SpyOver. Now let’s explain sorting.
You can sort by: newest, running longest, received most traffic, real views.
- By newest: sorting ads from newest to oldest. It means firstly SpyOver shows you ads that replenished base a few minutes or hours ago and then ads that was replenished some days, weeks or months ago (it depends on the period that you chose).
- Running longest: sorting from the longest launched campaign to shorter. How many days launched ad you can find in mini ad card. This sorting helps to find running longest and stable ad campaigns.
- By popularity: sorting native ads by views from millions views to ads with low views. With this sorting it’s easy to find the most viewed ads, determine popularity by geos, devices, traffic sources etc.
-
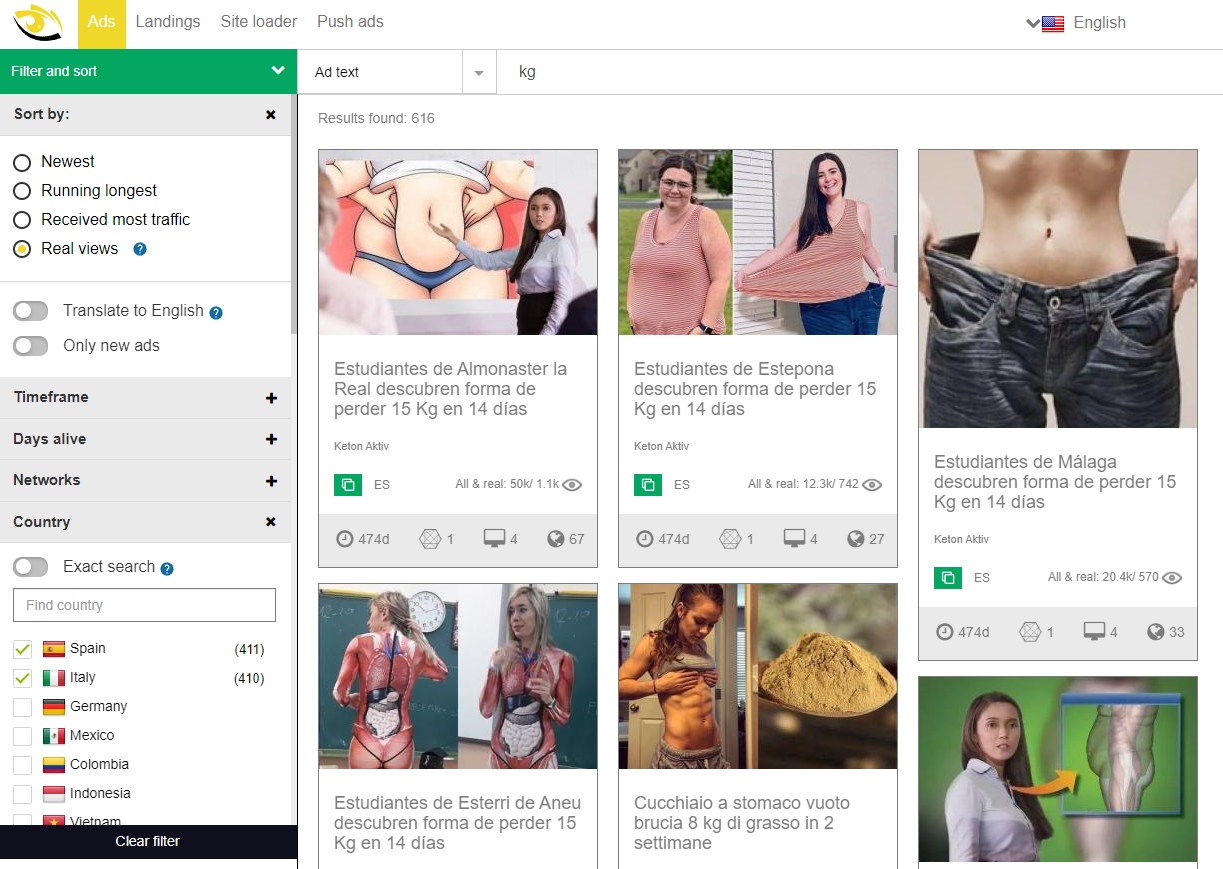
Real views: this sorting available only for a period of 30 days.
How it works?- Choose a period, but not more than 30 days.
- Choose country or countries.
- Choose devices.
- Apply “Real views”. In mini ad card you will find info by real views (by set parameters) and views for all time by all countries and devices.
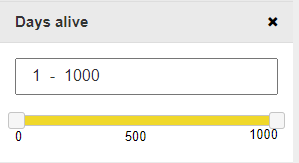
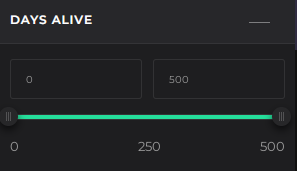
Next - Days alive is sorting ads by numbers of days launching advertising campaign. For example you are interested in analyzing advertising campaigns that were launched more than 100 days ago. Then you choose 110 days (for example) and learn running longest campaigns by your request and setted parameters (geo, devices etc).
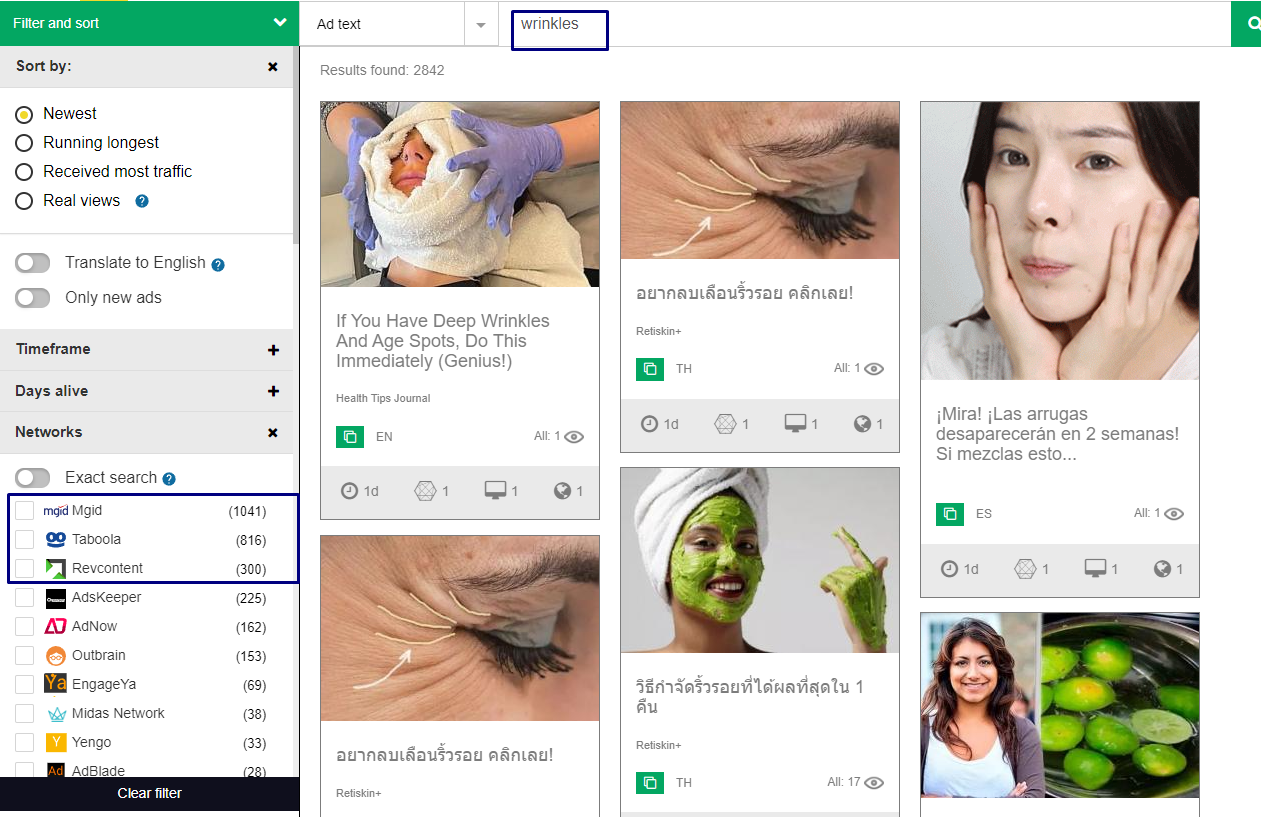
NETWORKS
In the left menu you will find a list of all networks with numbers of ads for each network. With this filter you can find and understand what traffic sources choose your competitors in their successful combinations.
In this example we see that by request “wrinkles” the most popular traffic source was Mgid - 1041, Taboola - 816, Revcontent - 300
List of countries with ad count for each country. You can find which geos choose for specific verticals that you are interested in, and which countries are the most popular in advertising campaigns of your competitors. Or choose some countries and analyze what is popular in advertising in these countries.
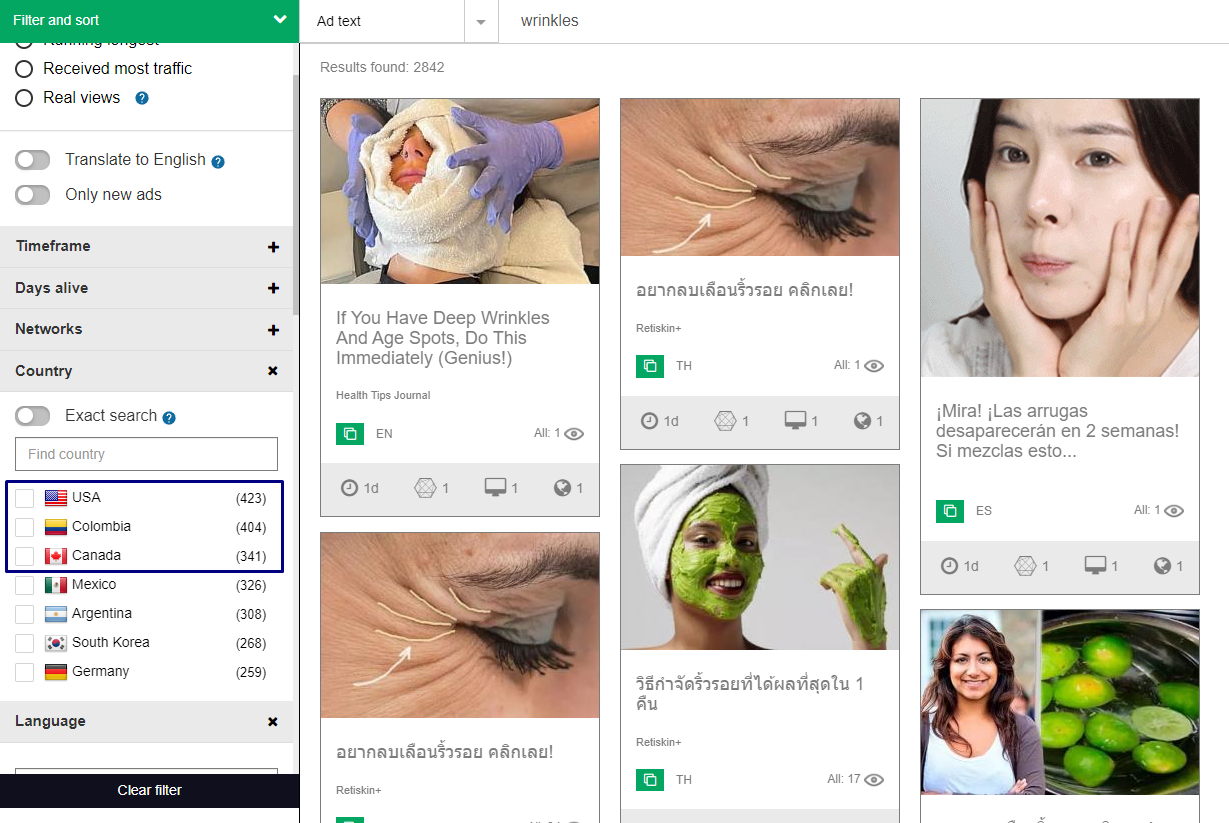
As we see the largest number of ads on this topic launched in the USA, Canada and Colombia.
Above the list of countries there is an option “Exact search”.
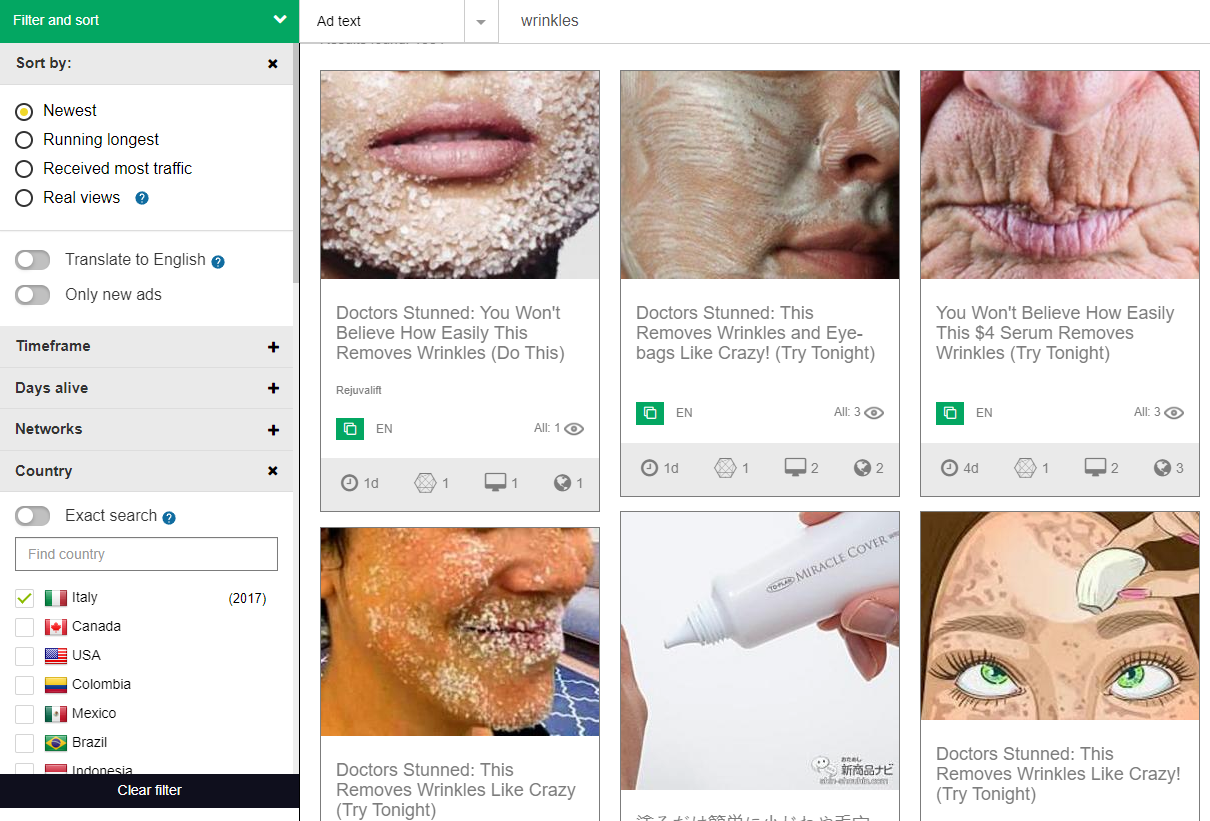
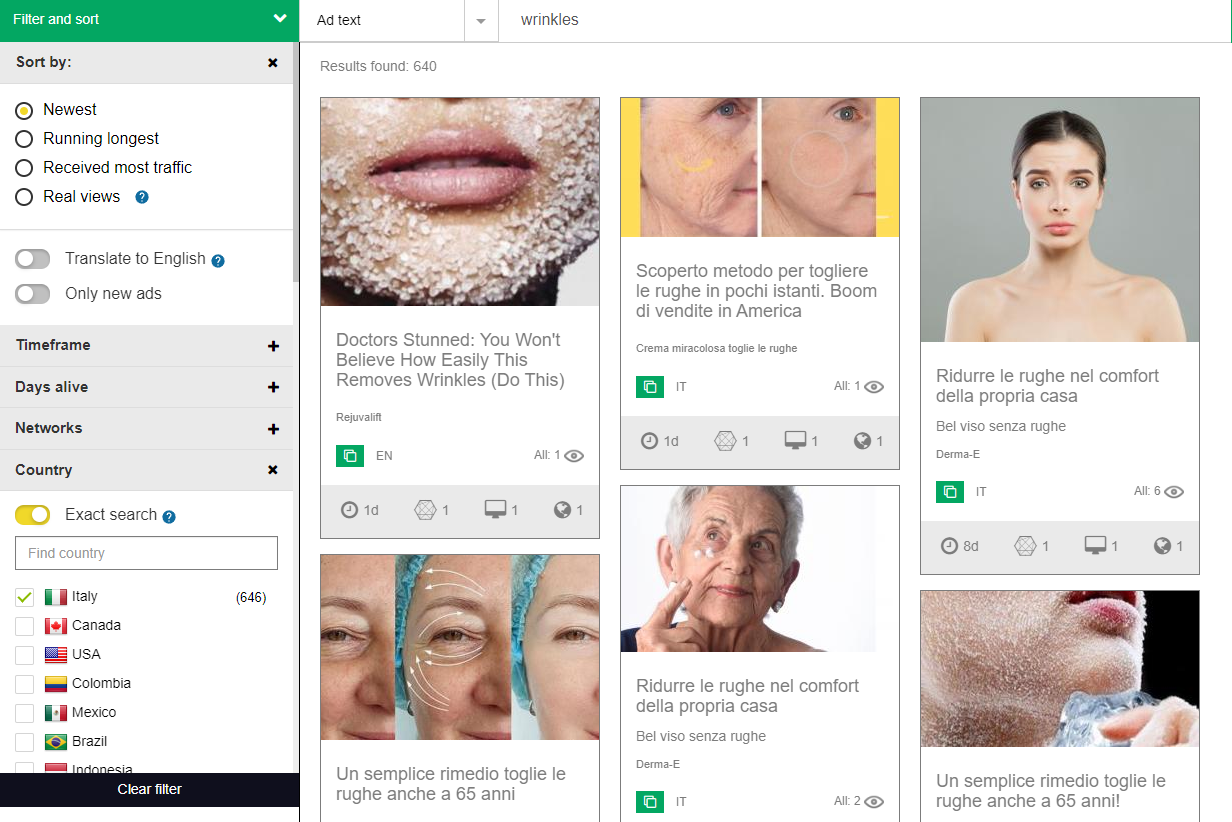
In order to put it into action, you need to select the countries of interest, for example, let's take Italy. We chose and we see the result - ads that are launched in Italy, but they are targeted at other countries too.
Before using Exact Search:
After using Exact Search:
LANGUAGE
This filtering option shows in what countries and in which languages are launching advertising campaigns. But pay attention with languages, because if you enter keywords in English it will show you results in English and in other languages that were translated from English to all languages in the system.
How it’s works? Let’s look an example:
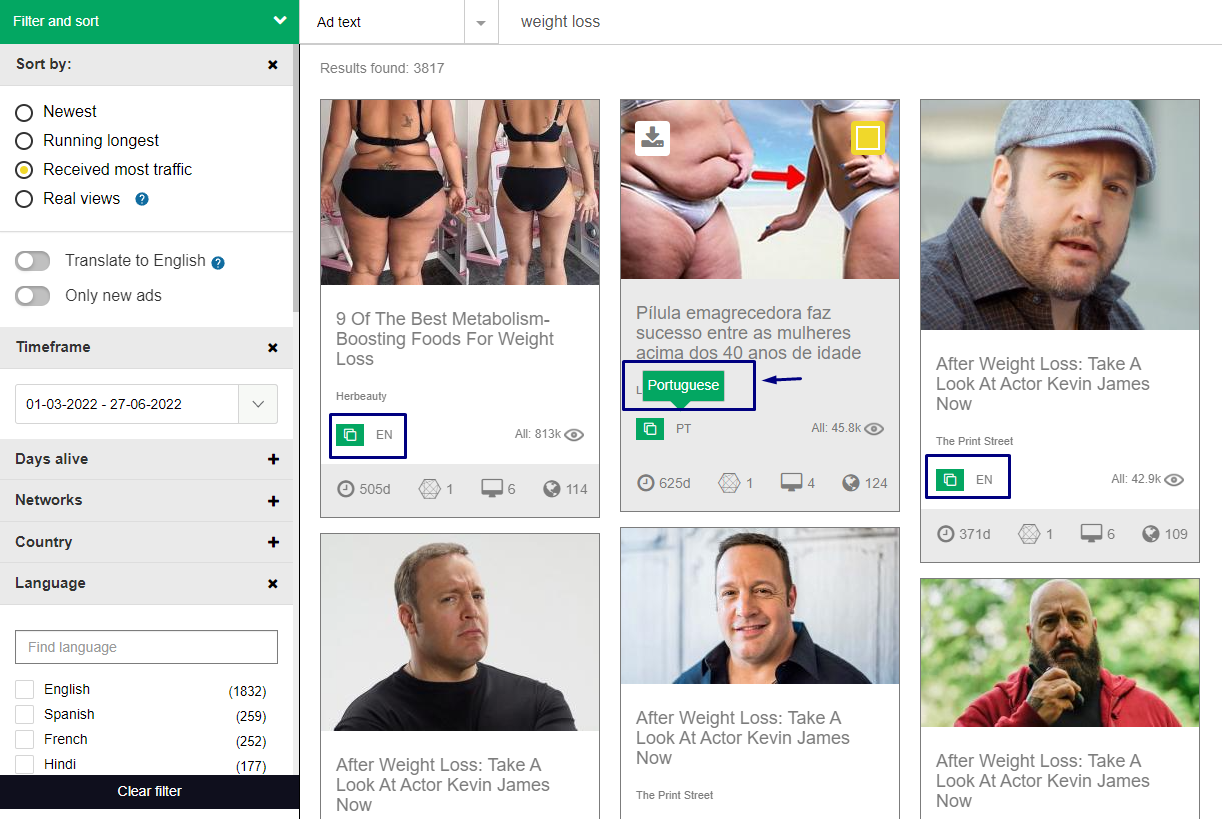
This feature will help you to get more ads in the result of search and you can get more ads of interest vertical in different geos.
DEVICE TYPE
In what devices are ads viewed? You can try option filtering by devices: Windows, OSX, Android mobile, IOS mobile, Android tablet, IOS tablet.
For example, if you launch an advertising campaign only for desktop devices, you can choose the filtering option Windows and get this result.
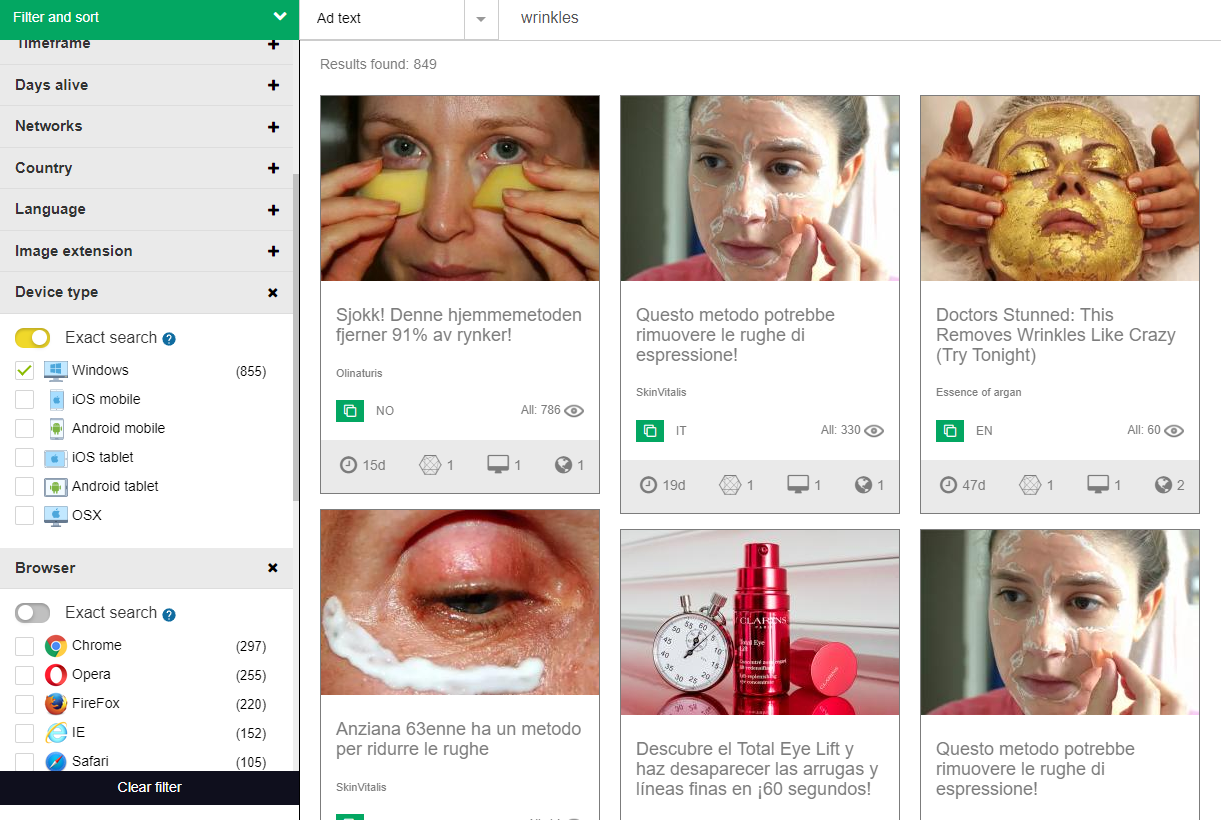
If Exact search turns on, then we will get ads ONLY for desktop devices with OS Windows.
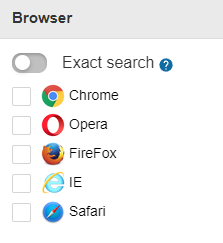
BROWSER
This filter helps to understand in what browsers viewed ads. There is also a feature already well known to you - Exact search.
Example:
AFFILIATE NETWORK
With this filter you will determine what affiliate network associated with the advertised offer.
Or choose a specific affiliate network or networks and analyze ads for understanding what is on top now, what attracts more traffic and what offers promote your competitors now.
TRACKING TOOL
It's an easy way to analyze ads by trackers with filtering by tracking tools. It helps to understand what tracker your competitors use in tracking traffic for their advertising campaigns. For example, you use Voluum and want to see what has been uploaded to Voluum over the past week.
Important! Option “Exact search” you can find in filters by networks, country, languages, devices, browsers, affiliate network, trackers.
At the bottom of the filters there is “Reset filters” - click and all filtering is reset. You can restart your search.
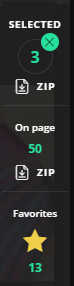
Also, you can open here and quickly see the information on each ad, without opening detailed ad statistics into each ad card. Here you can download the creative in zip (with text and image). Or mark all the creatives that you like and mass download all.

In the upper right corner, you can change the interface language - Russian or English. And next to your profile and the exit button. In the profile, you can change your personal data, including the password, and check your subscription in SpyOver.
Here you can find your personal profile link on SpyOver.
If you have any questions, feedback or ideas please write us Telegram: @SpyOver
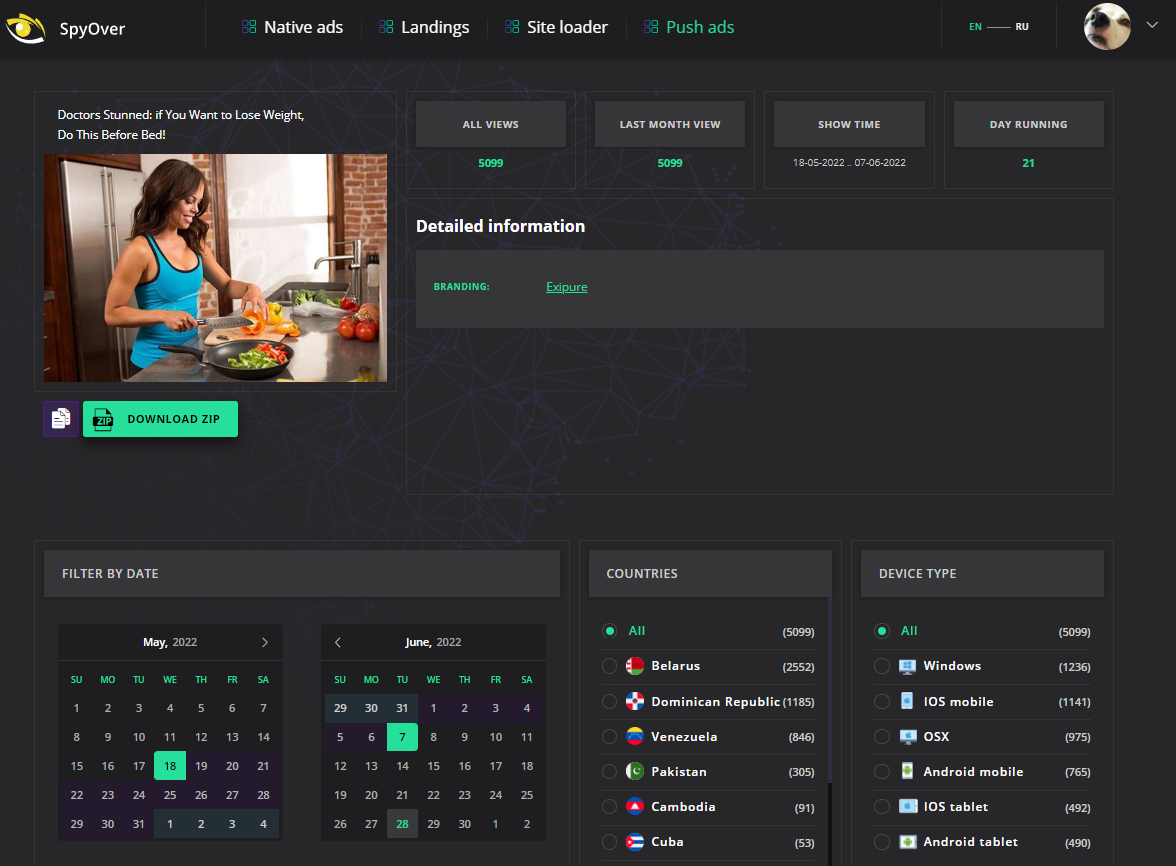
AD CARD
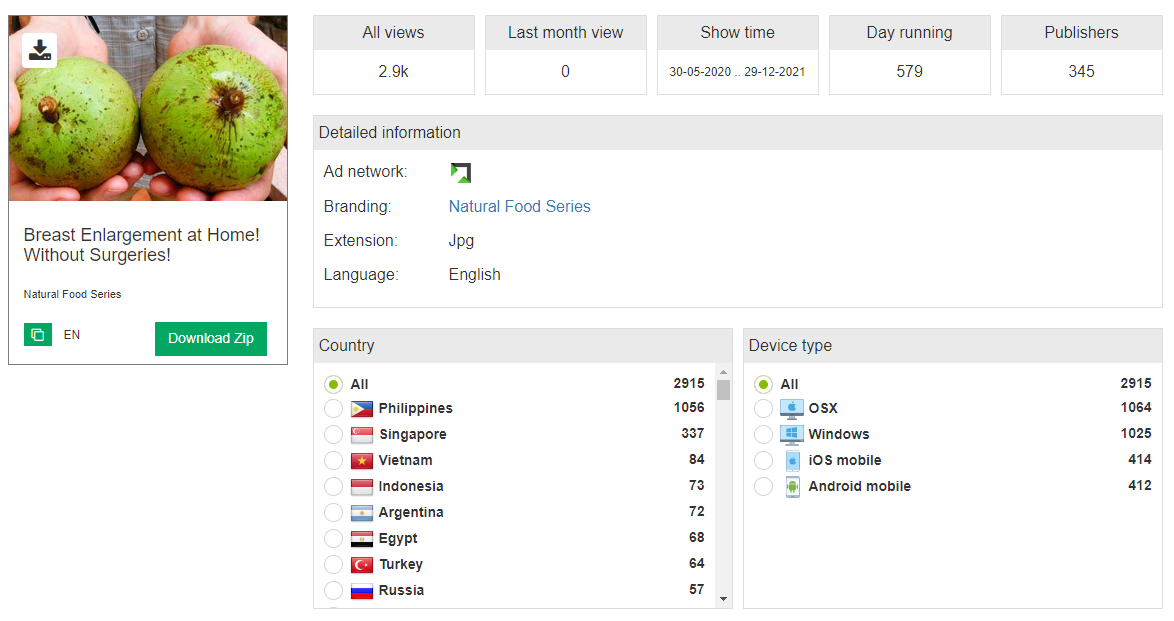
You can find detailed statistic info for each ad: how many views it got for the last month, show time, days running, numbers of publisher placements.
Below you will find detailed info about traffic sources, branding, ad extension, language, countries and device type.
Also you can download ad in zip (picture+ad text).
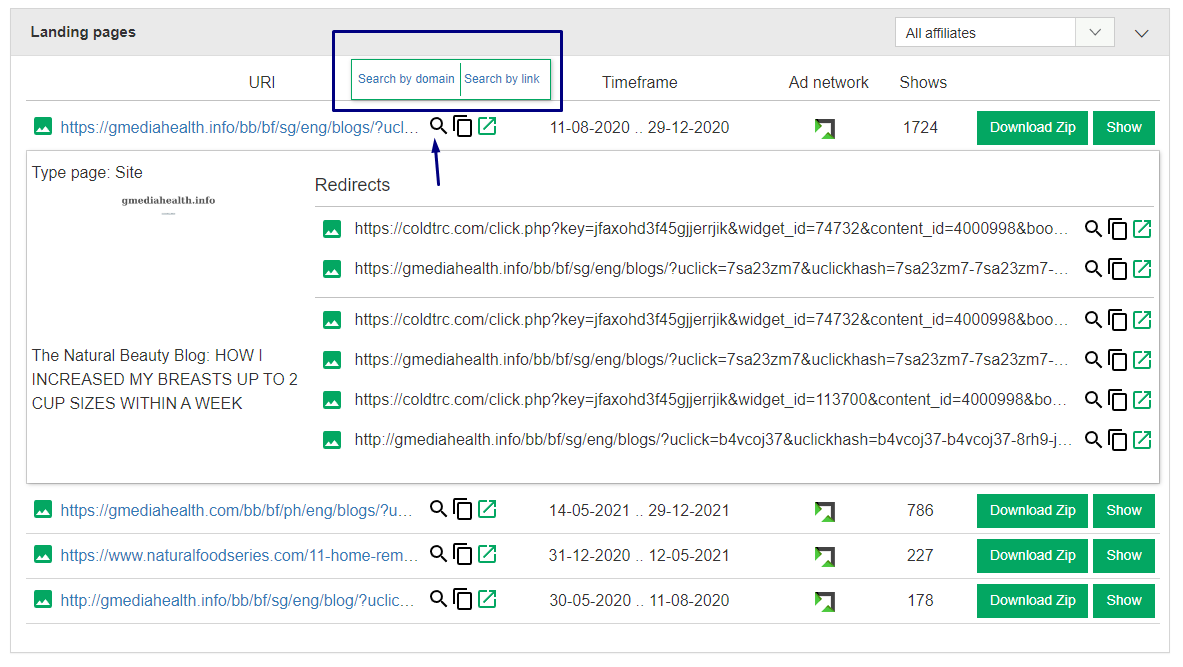
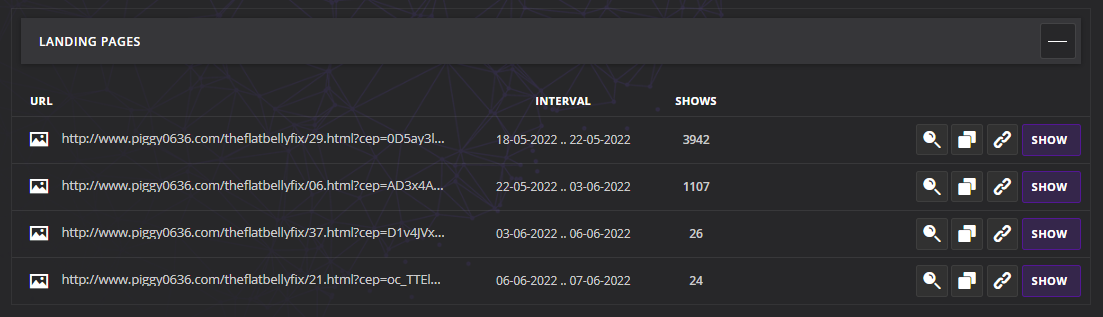
Below we can see links to all landings pages that are related to ad. With ability to download each in zip.
After clicking the button “Show” you will see all redirects links. Also, you can find page type, for example: transit page.
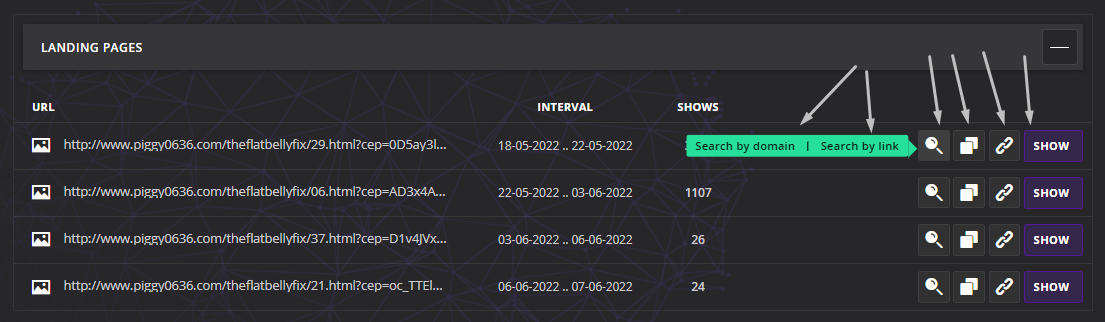
Here you can visit the landing page. After clicking the search icon 2 options appear: search by domain and search by link. If you click search by domain you are automatically redirected to the Ads section (where as a result you will see all the ads that are running for this domain). If you click search by link it will happen the same as in previous search, but with exact search by link with all get parameters.
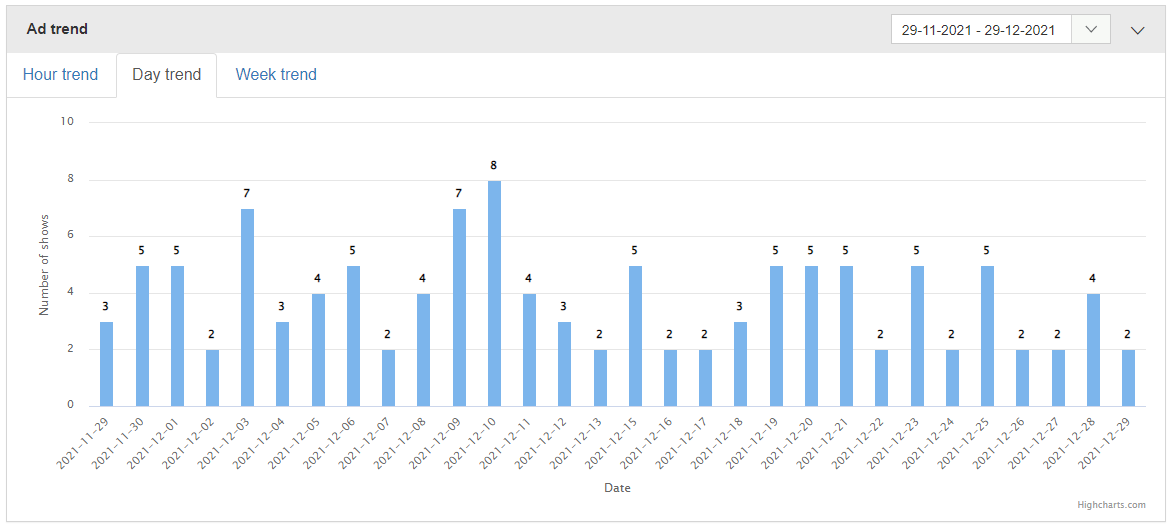
Next you will find info in charts by hours, days, weeks. It will help determine the best time to launch your own advertising campaign. On the right, you can select a calendar for information about views for a specific period of your interest. Info about ad trends by day, hour and week in the chart will be updated.
You can find top 10 publisher placements for each ad:
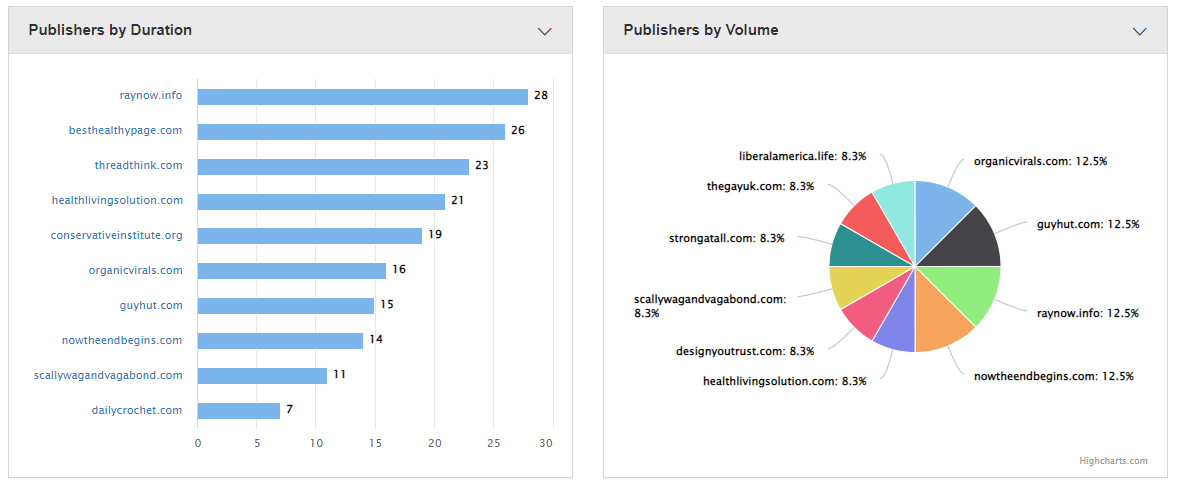
Publisher by duration it’s a publisher placements by numbers of days, how many days ad was shown in specific publisher placements. This info will help you determine publisher placements with the longest show of ad.
Publisher by volume - it’s publisher placements by view volume. On the graph you will see the top 10 publisher placements and the percentage of views. You will determine on which sites ad receives a large portion of traffic.
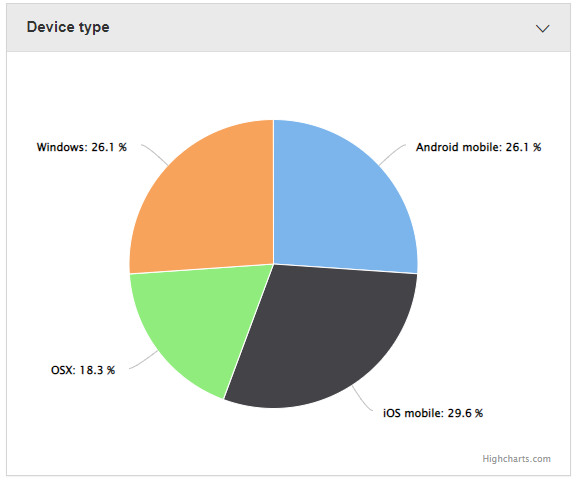
Below is a graph by device type, which shows for which devices the advertising campaign is launched and the percentage of views for each device.
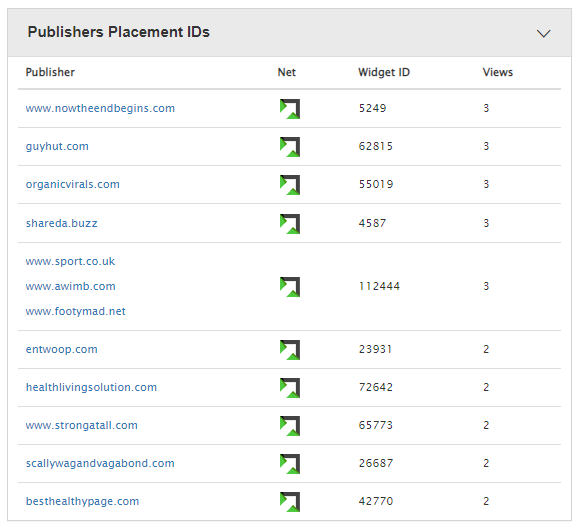
To the right of the graph by devices there is a table that shows the connection between the site and Widget ID in the network. Widget ID statistics are currently available for these networks: Mgid, Revcontent, Taboola, Content.Ad и AdNow.
It’s a great helper in creating Black and White lists. Based on the analysis of views by publisher placements, it is easier to understand which publisher placements are classified as White and Black lists.
Next graphs Traffic sources by Duration and by Volume and Geo by Volume.
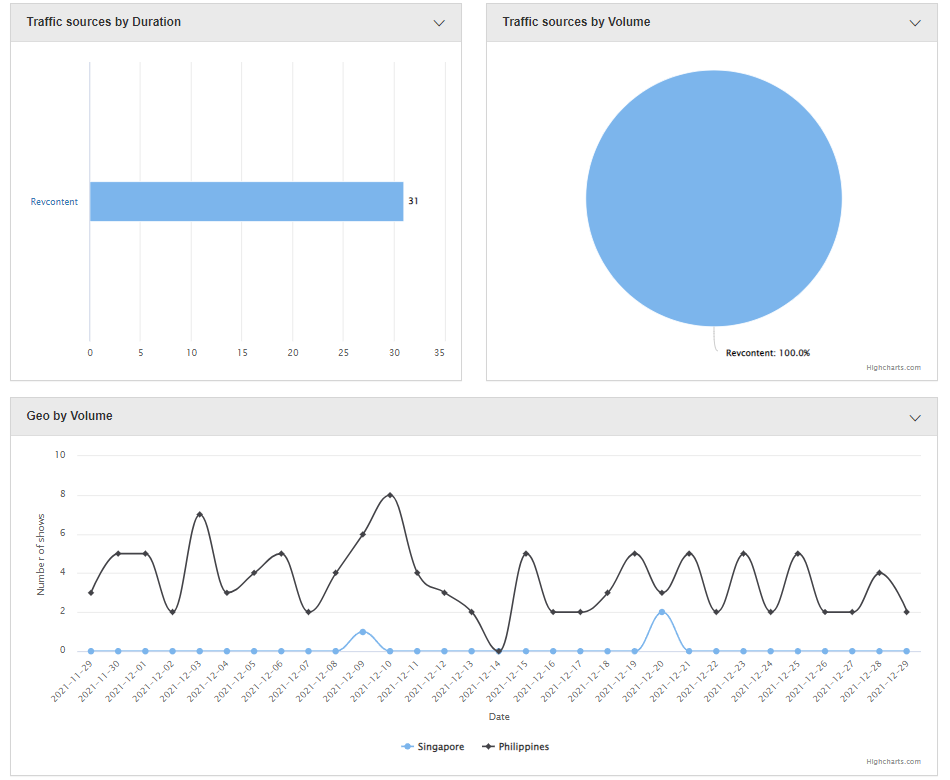
Traffic sources by Durations show us how many days advertising campaigns interacted with a specific network.
Traffic sources by Volume it is traffic sources percentage ratio for advertising campaign.
Geo by Volume helps you to understand dynamics of advertising campaign popularity by day for all GEOs where it is promoted.
Detailed analysis of every piece of advertising campaign will help you to understand what settings you should try in your own advertising campaign (what traffic sources, geos, time for launching and even the best hour for launch advertising campaigns).
LANDINGS
Transit pages, landings, sites and apps you will find in Landigns.
You can search by: landing url, meta title, landing page text (keywords), outgoing.
Landing Url - it’s search for a specific url address
Meta title - search by meta title (if you know the exact meta title or suggest that such a title is possible). This search gives you results for your needed vertical.
Landing page text - search by keywords that contains in Landing page.
Outgoings - helps to find ads on specific external links.
Next you can find in the left side menu sorting by:
- landing type
- networks
- countries
- language
- affiliate networks
- trackers
In the search results, when you click on the bottom info panel of a landing page, you can immediately go to the ads section for this landing page. Example:
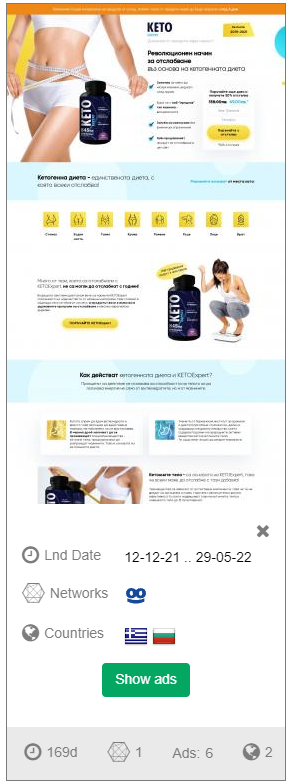
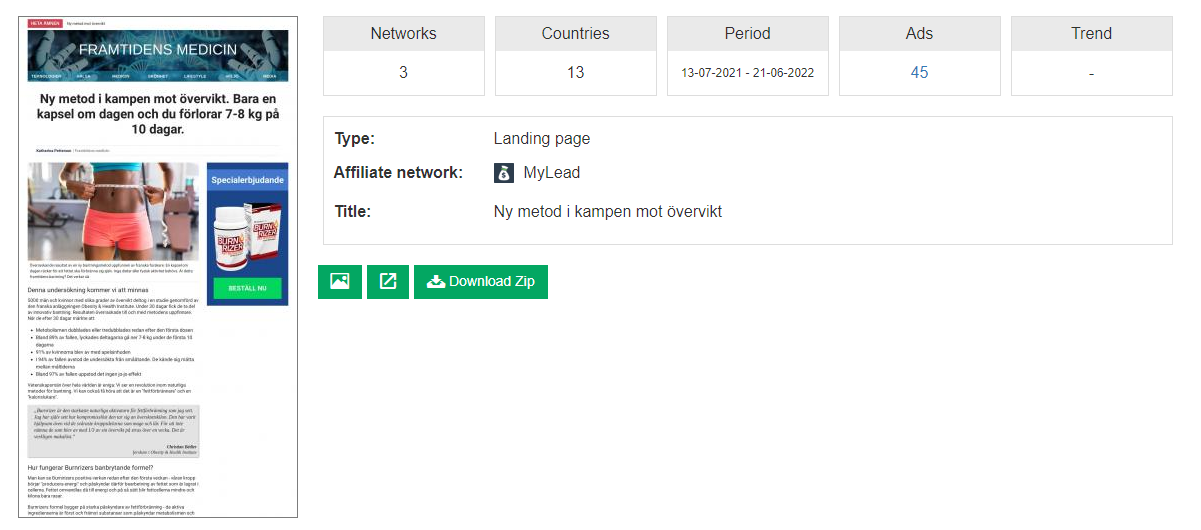
For every landing page you can find detailed info about traffic sources, countries, devices, period, numbers of ads and landing page trend.
The landing trend is calculated from the dynamics of landing impressions to users.
For displaying landing page trend SpyOver needs to collect a certain amount of data, so some landing pages may not have this indicator.
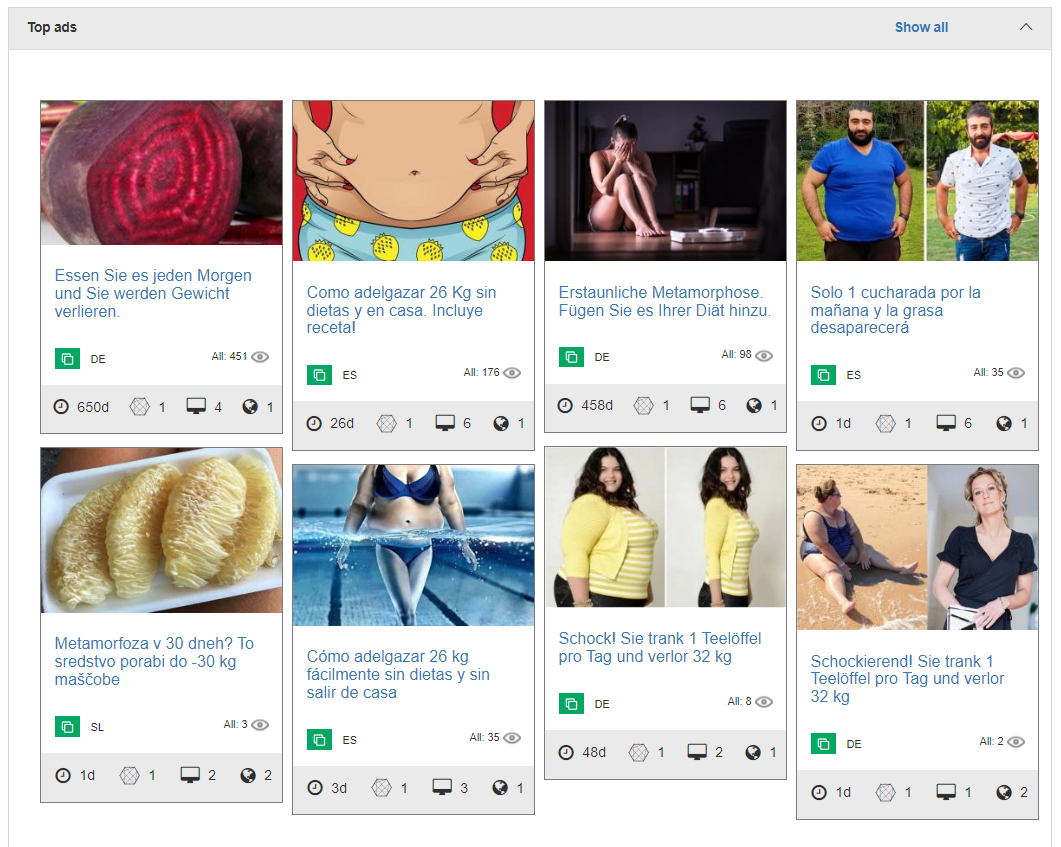
And one of the main things - top ads for landing page.
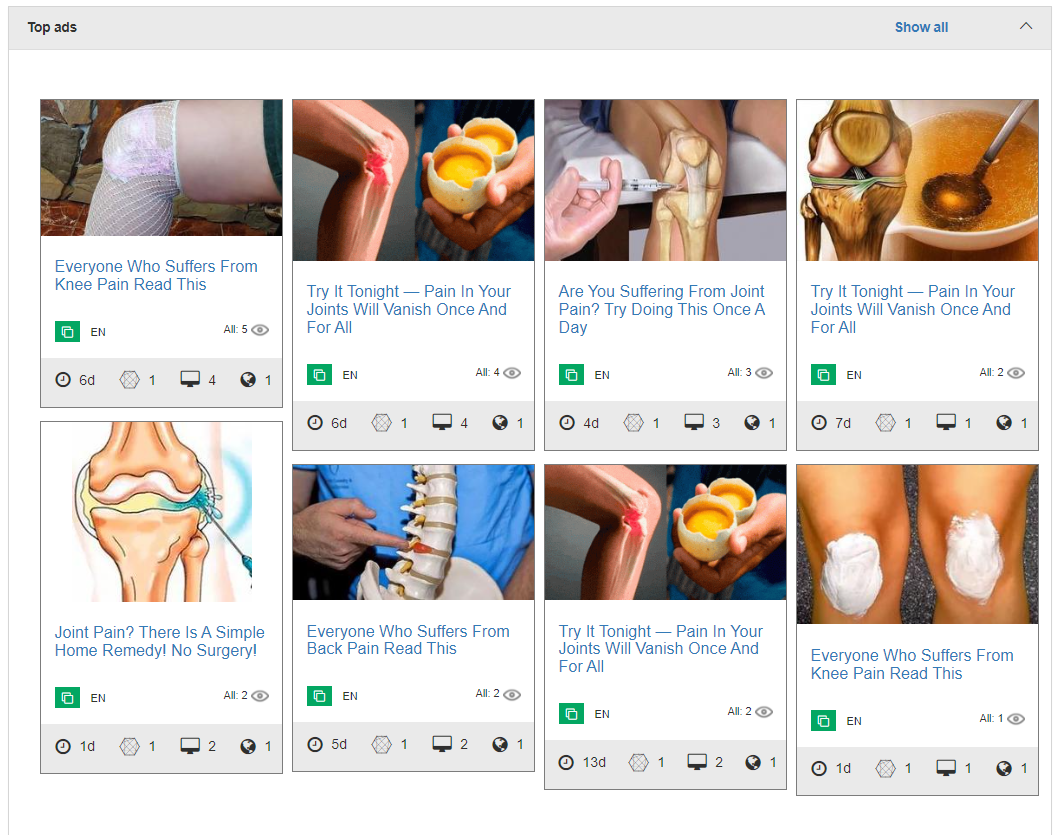
SITE LOADER
Site Loader it’s a special tool for downloading transit pages, landing pages and sites with all html and JS files in zip.
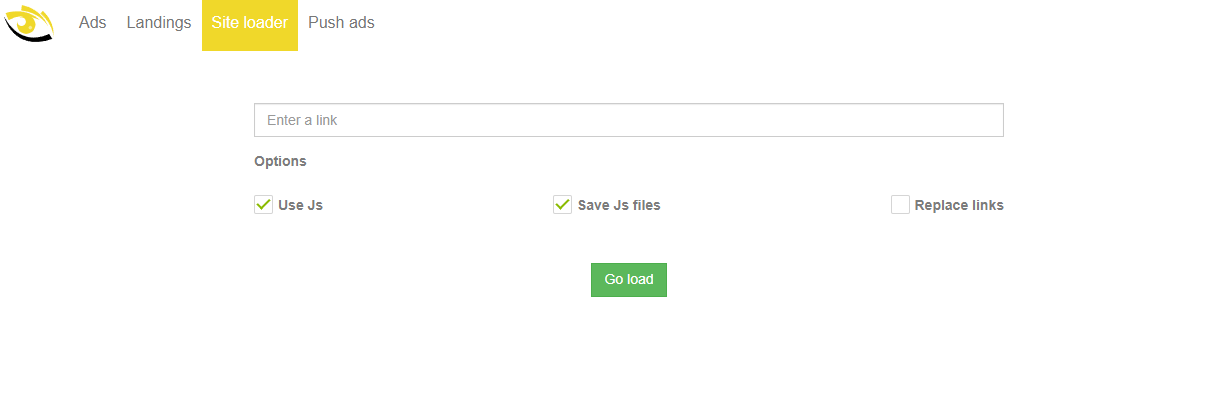
Use JS - landing will be downloaded with the execution of all js scripts, this will help to download the landing more efficiently if it is complex (if it is simple, then it is possible without js processing).
Save JS files - downloading js files locally (do not leave them with a remote connection to external resources)
Replace links - this is mass replacement of links with your own link. It will be useful if you download transit and its links lead to the landing (it means there is the same link in all places).
Just paste the link into the search and click download.
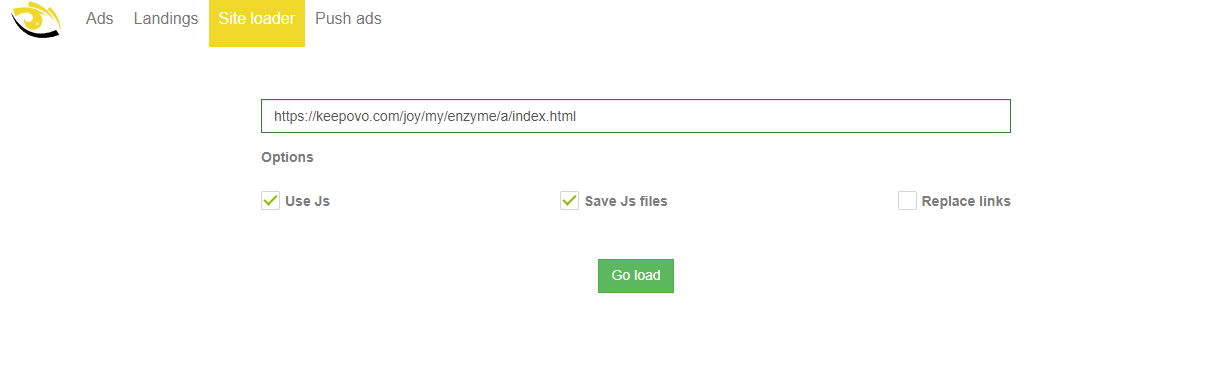
After that, the download task is sent for processing.
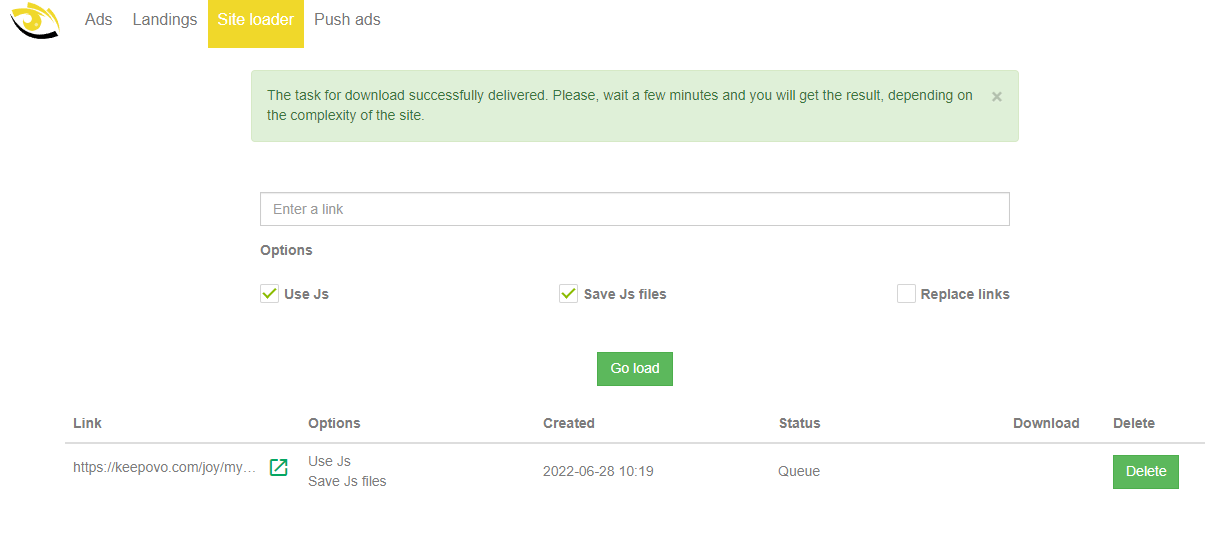
Then you will see the button “Download” (if it doesn't appear after some time, then you need to reload the page).

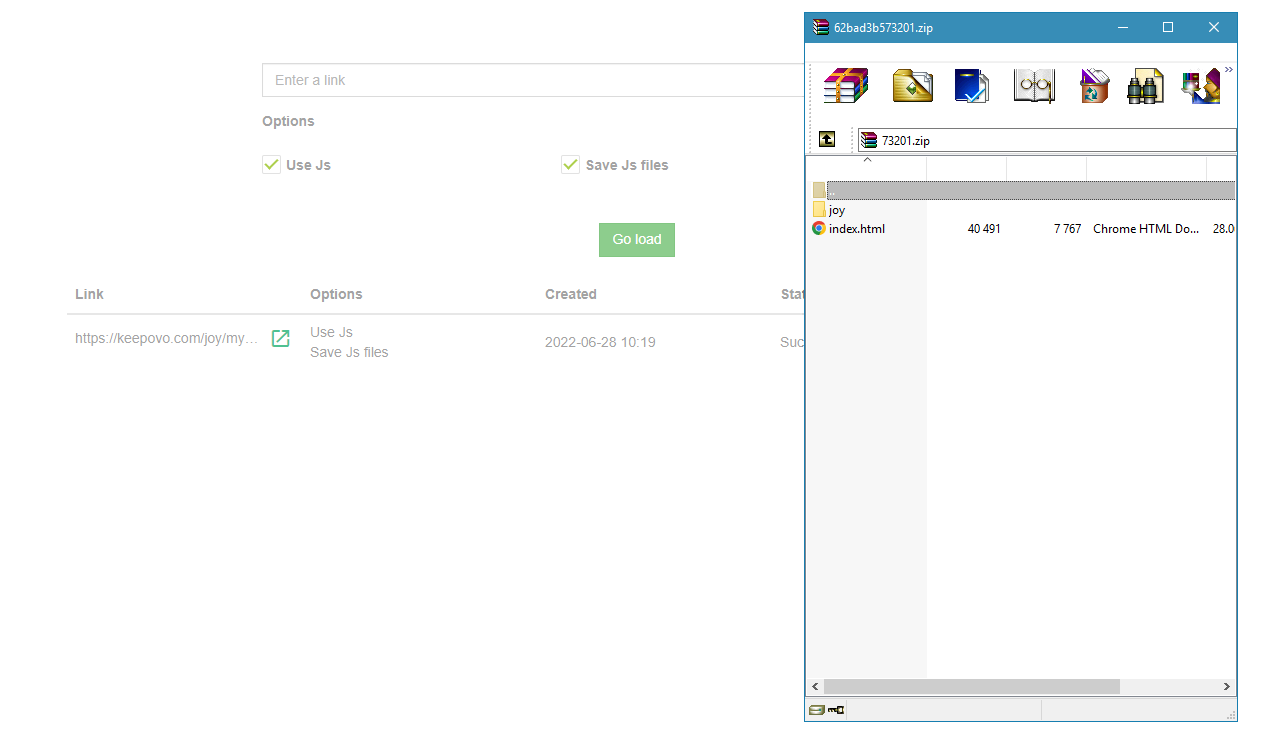
As a result we get such zip with files:
PUSH ADS
In Push Ads Page you can search ads by:
- ad text
- redirects
- landing page text
- offers
The same as in the Ads section you can use the option “Only new ads”.
Details about search you can read in the tutorial above.
In the left side menu there are all the same sortings as in the Ads section:
- by newest
- running longest
- received most traffic
Saved filters it’s a feature for saving the specified filters for the search at the next authorization on the service. You will already have search parameters prepared and will not have to re-select the same sorting and filtering.
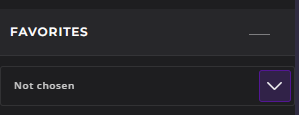
Favorites - it’s for saving all ads that you are interested in.
How can you use it? Mark any number of push ads you like, click on the star icon in the right menu:
Next, the service will offer you to save the selected ads to your favorites:
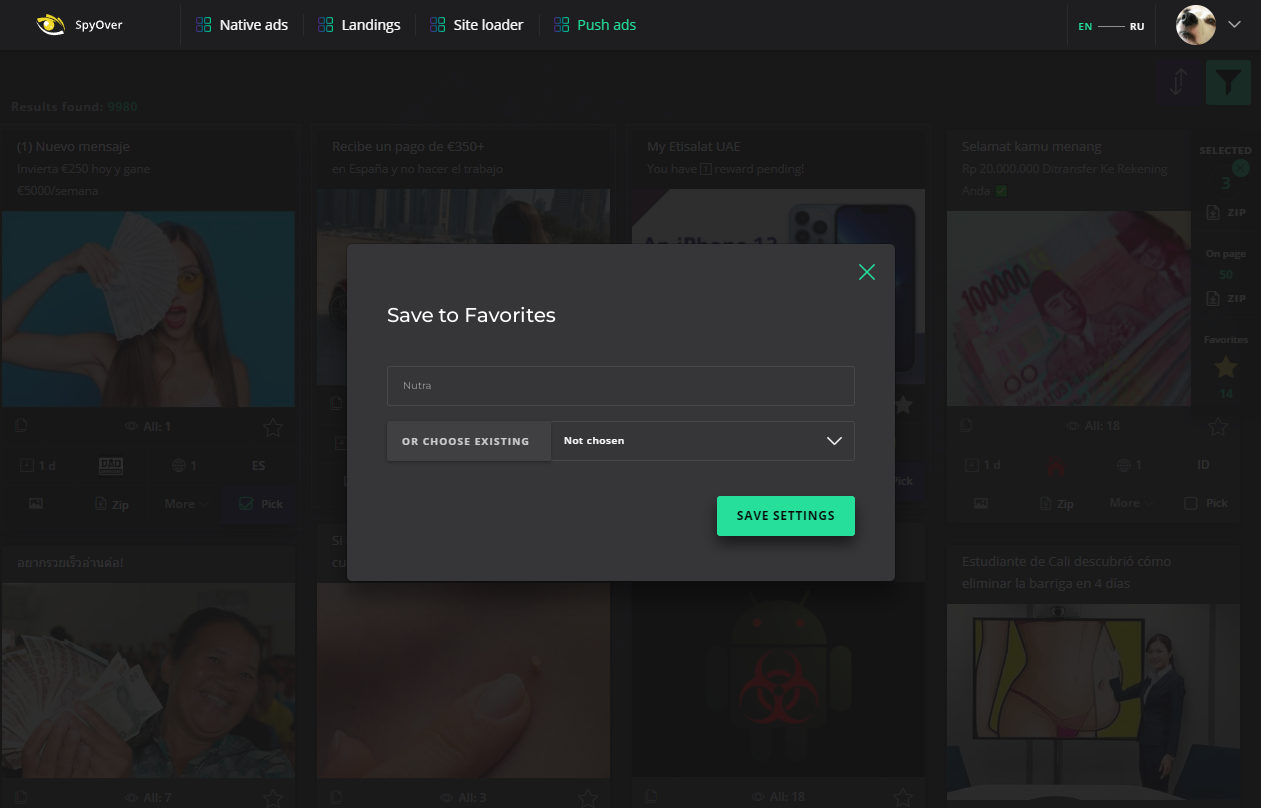
Enter tag name or choose from list if you have already created it and click save settings.
Saved as favorites you can found here:
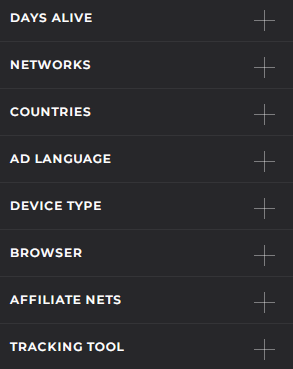
For analysis advertising for some period in the left side menu you can find filter option “Days alive”.
- traffic sources
- countries
- languages
- device type
- browser
- affiliate network
- tracking tool
For each push ad you will get detailed statistics info:
Detailed analysis helps to understand how long an ad was launched, show time, numbers of views, info about its popularity by geos and devices.
In the ad card you also will find info about ad transit and landing pages.
After clicking the search icon you will see search by domain and search by link and you can search that way other ads for this landing page.
If you click copy icon you will copy a landing page link.
Third icon view - after clicking you will visit landing page.
Button “Show” will show you all redirects.
Next you will see Ad trend by days and weekly. And below this graph you will find graphs Devices by Volume.
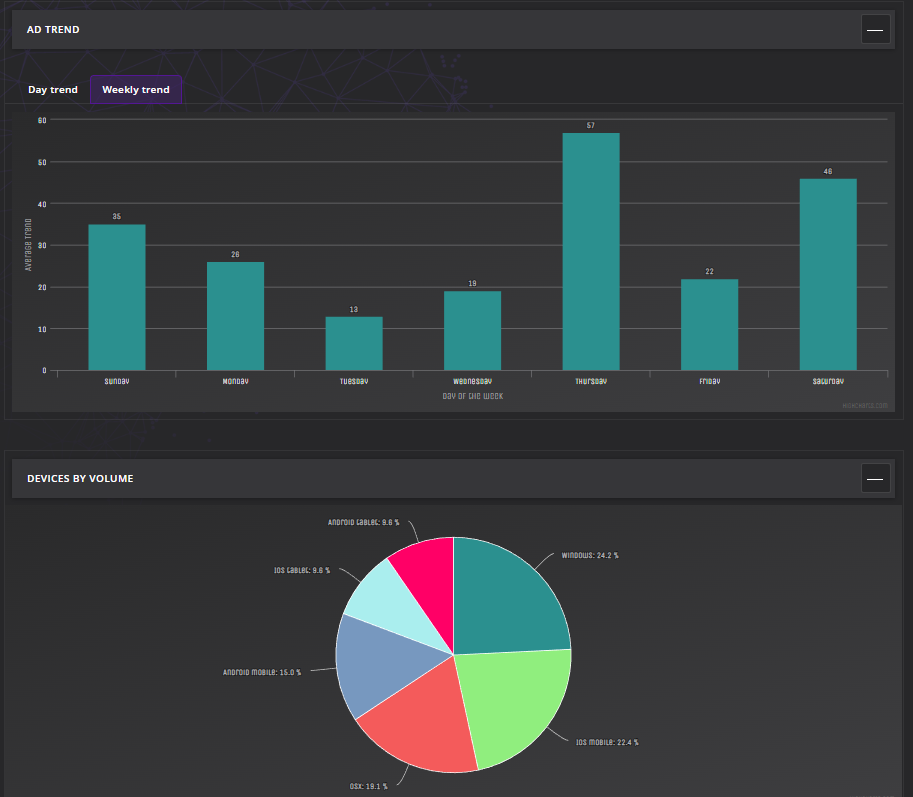
You can download in zip (picture and text) all ads that you are interested in.